EQUITIES RETREAT AGAIN PUSHING THE S&P 500 INTO CORRECTION TERRITORY AS 3Q REAL GDP NUMBERS COME IN SURPRISINGLY HIGH
- It was another rough week for equities as there was more risk aversion related to the escalating Israel-Hamas war, especially later in the week
- When the week was over, the four major U.S. equity indices were all off more than 2%, with the smaller-cap Russell 2000 and tech-laden NASDAQ both losing 2.6% and the large-cap S&P 500 (-2.5%) and the mega-cap DJIA (-2.1) struggling too
- Adding insult to injury, the S&P 500 is now 10.3% lower than its July 31 closing high, which puts it in correction territory alongside NASDAQ, which entered correction territory last week
- Ten of the 11 S&P 500 sectors declined, with only Utilities (+1.2%) advancing while Communication Services (-6.3%) and Energy (-6.2%) were hit hardest
- It was a big earnings week with 1/3 of the S&P 500 reporting, but most attention was on the household tech names of Google (Alphabet), Facebook (Meta), Microsoft and Amazon
- Google dropped almost 10% on arguably mixed earnings and Facebook pulled back about 4% after its earnings were released
- Microsoft and Amazon saw positive price action after reporting quarterly results
- Geopolitical worries cast a huge shadow all week and peaked on Friday amidst reports that the US carried out airstrikes against Iranian backed targets in Syria
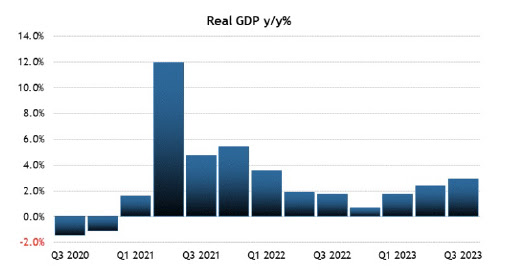
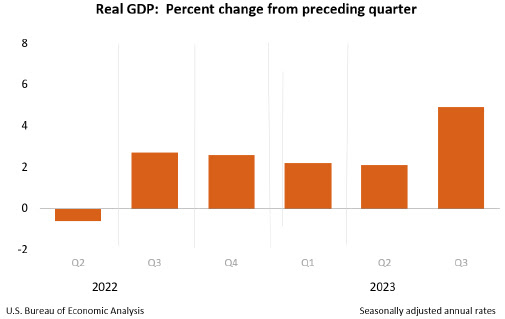
- There was a lot of economic data this week, but the surprising 4.9% real GDP growth numbers in the third quarter dominated the other data sets
- The 2-year Treasury yield dropped 6 basis points to 5.03% and the 10-year Treasury dropped 7 basis points to 4.85%
Weekly Market Update – October 27, 2023
|
Close |
Week |
YTD |
|
|
DJIA |
32,418 |
-2.1% |
-2.2% |
|
S&P 500 |
4,117 |
-2.5% |
+7.2% |
|
NASDAQ |
12,643 |
-2.6% |
+20.8% |
|
Russell 2000 |
1,637 |
-2.6% |
-7.1% |
|
MSCI EAFE |
1,945 |
-0.2% |
+0.7% |
|
Bond Index* |
1,997.76 |
+0.65% |
-2.49% |
|
10-Year Treasury |
4.85% |
-0.07% |
+1.0% |
*Source: Bonds represented by the Bloomberg Barclays US Aggregate Bond TR USD.
This chart is for illustrative purposes only and does not represent the performance of any specific security. Past performance cannot guarantee future results
Stocks and Equities Retreat and Push S&P 500 Into Correction Territory
It was the second consecutive week that the major U.S. stock benchmarks retreated, driven by an escalating conflict in Israel, not-so-great corporate earnings, and worries of higher interest rates as the 10-year U.S. Treasury crested the 5% level for the first time in 16 years. The good news is that after cresting that 5% threshold on Monday, the yield on the 10-year U.S. Treasury did trend lower for the rest of the week.
This week saw a ton of earnings reports, as close to 1/3 of S&P 500 companies reported this week alone. And while the results were mostly mixed, Wall Street focused on the big tech names of Amazon, Google (Alphabet), Facebook (Meta), and Microsoft. And interestingly, most reported good numbers, but it still was not enough to pull markets into the green column.
There was an abundance of economic data to digest this week, including that:
- Real GDP increased at an annual rate of 4.9% following a 2.1% increase in the second quarter.
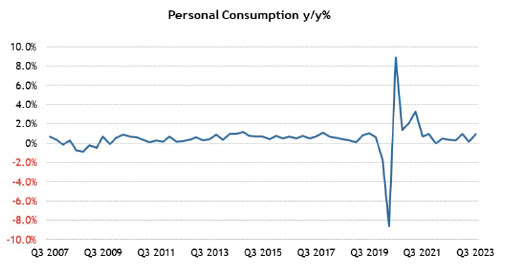
- Personal consumption expenditure growth increased 4.0%, up from 0.8% in the second quarter, and contributed 2.69 percentage points to growth.
- Gross private domestic investment jumped 8.4%, up from 5.2% in the second quarter, and contributed 1.47 percentage points to growth.
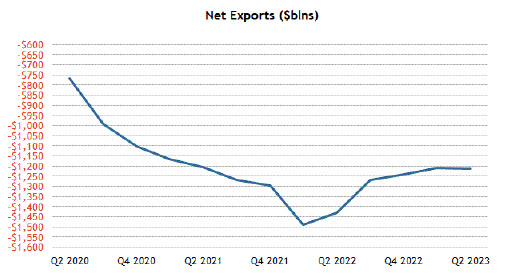
- Exports increased 6.2% after declining 9.3% in the second quarter. Imports rose 5.7% after declining 7.6% in the second quarter. Net exports subtracted 0.08 percentage points from growth.
- Government spending growth was 4.6%, up from 3.3% in the second quarter, and contributed 0.79 percentage points to growth.
- Real final sales of domestic product, which excludes the change in private inventories, was 3.5% versus 2.1% in the second quarter.
- The personal savings rate as a percentage of disposable personal income was 3.8% compared to 5.2% in the second quarter.
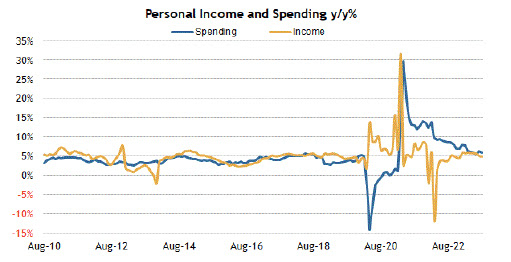
- Personal Income increased 0.4% month-over-month in August after increasing 0.2% in July.
- Personal spending was up 0.4% month-over-month after increasing an upwardly revised 0.9% (from 0.8%) in July.
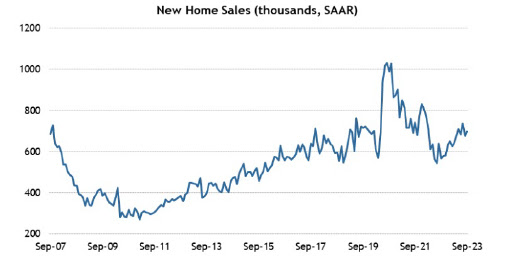
- New home sales increased 12.3% month-over-month in September to a seasonally adjusted annual rate of 759,000 units. That was the strongest rate of sales since February 2022.
- On a year-over-year basis, new home sales were up 33.9%.
- The median sales price declined 12.3% year-over-year to $418,800 while the average sales price declined 4.9% to $503,900.
- September marked the sixth straight month of a year-over-year decline in the median selling price.
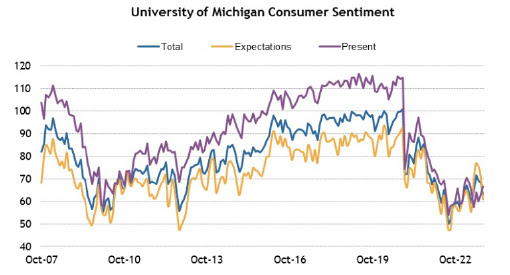
- The preliminary reading for the University of Michigan Consumer Sentiment Index for October came in at 63.0 versus the final reading of 68.1 for September.
- In the same period a year ago, the index stood at 59.9.
GDP Rises More Than Expected
On Thursday, the Bureau of Economic Analysis reported that real gross domestic product (GDP) increased at an annual rate of 4.9% in the third quarter of 2023. In the second quarter, real GDP increased 2.1%.
“The increase in real GDP reflected increases in consumer spending, private inventory investment, exports, state and local government spending, federal government spending, and residential fixed investment that were partly offset by a decrease in nonresidential fixed investment. Imports, which are a subtraction in the calculation of GDP, increased.
The increase in consumer spending reflected increases in both services and goods. Within services, the leading contributors were housing and utilities, health care, financial services and insurance, and food services and accommodations. Within goods, the leading contributors to the increase were other nondurable goods (led by prescription drugs) as well as recreational goods and vehicles. The increase in private inventory investment reflected increases in manufacturing and retail trade. Within nonresidential fixed investment, a decrease in equipment was partly offset by increases in intellectual property products and structures.
Compared to the second quarter, the acceleration in real GDP in the third quarter reflected accelerations in consumer spending, private inventory investment, and federal government spending and upturns in exports and residential fixed investment. These movements were partly offset by a downturn in nonresidential fixed investment and a deceleration in state and local government spending. Imports turned up.”
Corporate Earnings for Q3
According to research firm FactSet with 49% of S&P 500 companies reporting as of Friday:
- 78% of S&P 500 companies have reported a positive EPS surprise.
- 62% of S&P 500 companies have reported a positive revenue surprise.
- The blended (year-over-year) earnings growth rate for the S&P 500 is 2.7%. If 2.7% is the actual growth rate for the quarter, it will mark the first quarter of year-over-year earnings growth reported by the index since Q3 2022.
- The forward 12-month P/E ratio for the S&P 500 is 17.1. This P/E ratio is below the 5-year average (18.7) and below the 10-year average (17.5).
Consumer Sentiment Drops
The University of Michigan reported that “consumer sentiment fell back about 7% this October following two consecutive months of very little change. Assessments of personal finances declined about 15%, primarily on a substantial increase in concerns over inflation, and one-year expected business conditions plunged about 19%. However, long-run expected business conditions are little changed, suggesting that consumers believe the current worsening in economic conditions will not persist. Nearly all demographic groups posted setbacks in sentiment, reflecting the continued weight of high prices.
Year-ahead inflation expectations rose from 3.2% last month to 3.8% this month. The current reading is the highest since May 2023 and remains well above the 2.3-3.0% range seen in the two years prior to the pandemic. Long-run inflation expectations edged up from 2.8% last month to 3.0% this month, again staying within the narrow 2.9-3.1% range for 25 of the last 27 months. Long-run inflation expectations remain elevated relative to the 2.2-2.6% range seen in the two years pre-pandemic.”
US Private Sector Growth Edges Higher While Inflationary Pressures Ease
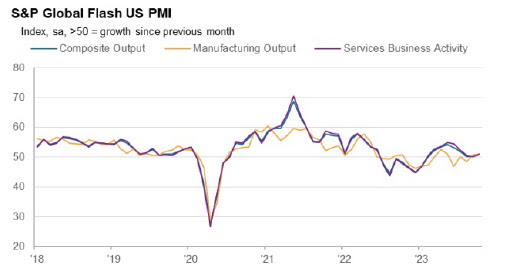
On Tuesday, S&P Global released the following: “Overview US companies signalled a marginal expansion in business activity during October, following broadly stagnant output seen in August and September. Manufacturers and service providers alike reported improved activity levels as the downturn in demand moderated. The rise in total output was the quickest for three months.
Demand conditions at manufacturers improved for the first time since April, while service providers saw a slower drop in new orders.
Meanwhile, inflationary pressures softened. Cost burdens rose at the slowest pace for three years, with firms moderating hikes in selling prices at the same time.
The rate of charge inflation eased to the weakest since June 2020 and was slower than the long-run series average. Firms were reportedly keen to pass through any cost savings made to customers in a bid to drive sales.
Commenting on the Data
“Hopes of a soft landing for the US economy will be encouraged by the improved situation seen in October. The S&P Global PMI survey has been among the most downbeat economic indicators in recent months, so the upturn in US output growth signalled at the start of the fourth quarter is good news. Future output expectations have also turned up despite rising geopolitical concerns and domestic political tensions, climbing to the joint-highest for nearly one-and-a-half years.
Sentiment has improved in part due to hopes of interest rates having peaked, something which looks increasingly likely given the further cooling of inflationary pressures News Release witnessed in October. In spite of higher oil prices, firms’ input cost inflation fell sharply to the lowest since October 2020, and average selling prices for goods and services posted the smallest monthly rise since June 2020.
The survey’s selling price gauge is now close to its pre-pandemic long-run average and consistent with headline inflation dropping close to the Fed’s 2% target in the coming months, something which looks likely to be achieved without output falling into contraction. That said, the tensions in the Middle East pose downside risks to growth and upside risks to inflation, adding fresh uncertainty to the outlook.”
Sources: bea.gov; spglobal.com; umich.edu; factset.com; msci.com; fidelity.com; nasdaq.com; wsj.com; morningstar.com
✅ BOOK AN APPOINTMENT TODAY: https://calendly.com/tdwealth
===========================================================
SEE ALL OUR LATEST BLOG POSTS: https://tdwealth.net/articles
If you like the content, smash that like button! It tells YouTube you were here, and the Youtube algorithm will show the video to others who may be interested in content like this. So, please hit that LIKE button!
Don’t forget to SUBSCRIBE here: https://www.youtube.com/channel/UChmBYECKIzlEBFDDDBu-UIg
✅ Contact me: TDavies@TDWealth.Net
====== ===Get Our FREE GUIDES ==========
Retirement Income: The Transition into Retirement: https://davieswealth.tdwealth.net/retirement-income-transition-into-retirement
Beginner’s Guide to Investing Basics: https://davieswealth.tdwealth.net/investing-basics
✅ LET’S GET SOCIAL
Facebook: https://www.facebook.com/DaviesWealthManagement
Twitter: https://twitter.com/TDWealthNet
Linkedin: https://www.linkedin.com/in/daviesrthomas
Youtube Channel: https://www.youtube.com/c/TdwealthNetWealthManagement
Lat and Long
27.17404889406371, -80.24410438798957
Davies Wealth Management
684 SE Monterey Road
Stuart, FL 34994
772-210-4031
DISCLAIMER
**Davies Wealth Management makes content available as a service to its clients and other visitors, to be used for informational purposes only. Davies Wealth Management provides accurate and timely information, however you should always consult with a retirement, tax, or legal professionals prior to taking any action.


Leave a Reply