EQUITIES MIXED AS OIL JUMPS FOR THE THIRD WEEK IN A ROW AND WEIGHS ON INFLATION DATA AHEAD OF THE FED’S DECISION NEXT WEEKWeekly Market Update — September 16, 2023 |
||||||||||||||||||||||||||||||||
|
||||||||||||||||||||||||||||||||
Weekly Market Performance
*Source: Bonds represented by the Bloomberg Barclays US Aggregate Bond TR USD. This chart is for illustrative purposes only and does not represent the performance of any specific security. Past performance cannot guarantee future results. |
||||||||||||||||||||||||||||||||
Stock Equities Mixed as Inflation is Also MixedDespite getting off to a great start, Friday’s retreat pushed most of the major indices into the red for the week, with only the mega-cap DJIA scratching out a tiny 0.2% gain. The other indices lost less than 1%, as hopes for a soft-landing increased ahead of the Fed’s major rate decision scheduled for next week. Rising oil prices pushed value stocks out ahead of growth stocks, as the benchmark West Texas Intermediate oil prices rose above $90/barrel for the first time since November 2022. Maybe worse than that is the fact that WTI oil has risen over 30% since July 1st. On Wednesday, the eagerly anticipated August CPI data was released and the data was, at best, mixed. On the one hand, the data showed that the Fed is making progress bringing certain elements of inflation down – but on the other hand, rising oil and energy prices might push the Fed to raise rates yet again next week. Then the very next day, the release of the August Producer Price Index showed that that headline producer prices advanced more than expected, causing more Fed-raising worries. There was a lot of economic data this week, including that:
|
||||||||||||||||||||||||||||||||
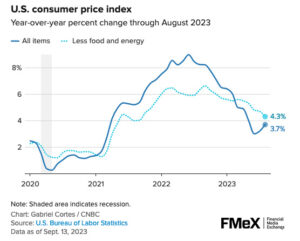
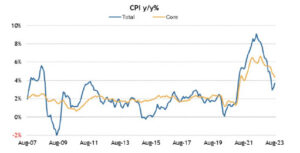
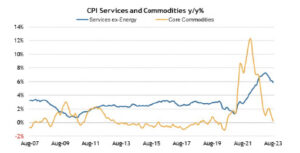
Consumer Price Index RisesTotal CPI increased 0.6% month-over-month in August, with rising gasoline prices accounting for over half of the increase. Core CPI, which excludes food and energy, rose a stronger-than-expected 0.3% month-over-month. On a year-over-year basis, total CPI was up 3.7%, versus 3.2% in July, and core CPI was up 4.3%, versus 4.7% in July. In addition:
|
||||||||||||||||||||||||||||||||
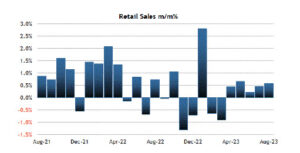
Retail Sales UpAugust retail sales increased 0.6% month-over-month following a downwardly revised 0.5% increase (from 0.7%) in July. Excluding autos, retail sales rose 0.6% month-over-month following a downwardly revised 0.7% increase (from 1.0%) in July. In addition:
|
||||||||||||||||||||||||||||||||
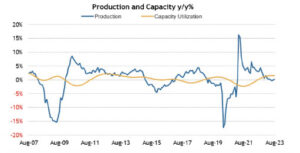
Industrial Production UpTotal industrial production increased 0.4% month-over-month in August following a downwardly revised 0.7% increase (from 1.0%) in July. The capacity utilization rate jumped to 79.7% from an upwardly revised 79.5% (from 79.3%) in July. And Total industrial production was up 0.2% year-over-year. The capacity utilization rate of 79.7% was in-line with its long-run average. In addition, it was reported that:
|
||||||||||||||||||||||||||||||||
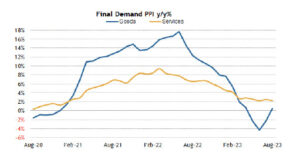
Producer Price Index IncreasesThe August Producer Price Index for final demand increased 0.7% month-over-month following a 0.3% increase in July. The index for final demand, excluding food and energy, increased 0.2% month-over-month. On a year-over-year basis, the index for final demand was up 1.6% and the index for final demand, excluding food and energy, was up 2.2%. Further:
|
||||||||||||||||||||||||||||||||
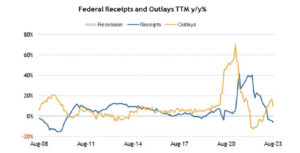
Treasury SurplusThe August Treasury Budget showed a surplus of $89.2 billion compared to a deficit of $219.6 billion in the same period a year ago. The surplus in August resulted from receipts ($283.1 billion) exceeding outlays ($193.9 billion). The Treasury Department also reported that:
|
||||||||||||||||||||||||||||||||
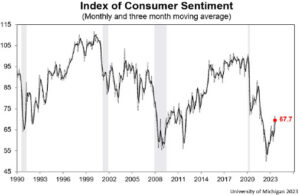
Consumer Sentiment DropsOn Friday, the University of Michigan reported that “consumer sentiment inched down a scant 1.8 index points this month and has been essentially flat for the past two months. At 67.7 points, sentiment is currently about 35% above the all-time historic low reached in June of 2022 but remains shy of the historical average reading of 86. Sentiment this month was characterized by divergent movements across index components and across demographic groups with little net change from last month. Notably, though, both short-run and long-run expectations for economic conditions improved modestly this month, though on net consumers remain relatively tentative about the trajectory of the economy. So far, few consumers mentioned the potential federal government shutdown, but if the shutdown comes to bear, consumer views on the economy will likely slide, as was the case just a few months ago when the debt ceiling neared a breach. Throughout the survey, consumers have taken note of the stalling slowdown in inflation, but they do expect the slowdown to resume. Year-ahead inflation expectations moderated from 3.5% last month to 3.1% this month. The current reading is the lowest since March 2021 and is just above the 2.3-3.0% range seen in the two years prior to the pandemic. Long-run inflation expectations came in at 2.7%, falling below the narrow 2.9-3.1% range for only the second time in the last 26 months. In comparison, long-run inflation expectations ranged between 2.2 and 2.6% in the two years pre-pandemic.” |
||||||||||||||||||||||||||||||||
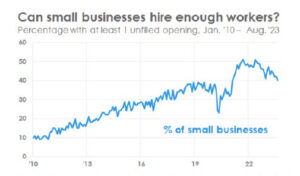
Optimism Among Small Business Owners Declined in AugustThe National Federation of Independent Business reported on September 12th that the “NFIB’s Small Business Optimism Index decreased 0.6 of a point in August to 91.3, the 20th consecutive month below the 49-year average of 98. Twenty-three percent of small business owners reported that inflation was their single most important business problem, up two points from last month. The net percent of owners raising average selling prices increased two points to a net 27% (seasonally adjusted), still at an inflationary level.” |
||||||||||||||||||||||||||||||||
| Sources
nfib.com; umich.edu ; bls.gov; msci.com; fidelity.com; nasdaq.com; wsj.com; morningstar.com; |
✅ BOOK AN APPOINTMENT TODAY: https://calendly.com/tdwealth
===========================================================
SEE ALL OUR LATEST BLOG POSTS: https://tdwealth.net/articles
If you like the content, smash that like button! It tells YouTube you were here, and the Youtube algorithm will show the video to others who may be interested in content like this. So, please hit that LIKE button!
Don’t forget to SUBSCRIBE here: https://www.youtube.com/channel/UChmBYECKIzlEBFDDDBu-UIg
✅ Contact me: TDavies@TDWealth.Net
====== ===Get Our FREE GUIDES ==========
Retirement Income: The Transition into Retirement: https://davieswealth.tdwealth.net/retirement-income-transition-into-retirement
Beginner’s Guide to Investing Basics: https://davieswealth.tdwealth.net/investing-basics
✅ LET’S GET SOCIAL
Facebook: https://www.facebook.com/DaviesWealthManagement
Twitter: https://twitter.com/TDWealthNet
Linkedin: https://www.linkedin.com/in/daviesrthomas
Youtube Channel: https://www.youtube.com/c/TdwealthNetWealthManagement
Lat and Long
27.17404889406371, -80.24410438798957
Davies Wealth Management
684 SE Monterey Road
Stuart, FL 34994
772-210-4031
DISCLAIMER
**Davies Wealth Management makes content available as a service to its clients and other visitors, to be used for informational purposes only. Davies Wealth Management provides accurate and timely information, however you should always consult with a retirement, tax, or legal professionals prior to taking any action.


Leave a Reply