

Here is the full HTML content with the internal links added:
“`html
“`html
EQUITY MARKETS JUMP ON THE WEEK AS THE FED’S KEY INFLATION NUMBER DROPS AND AS THE QUARTER AND MONTH COME TO A CLOSE
|
Weekly Market Update — March 31, 2023 |

|
Weekly Market Performance
*Source: Bonds represented by the Bloomberg Barclays US Aggregate Bond TR USD. This chart is for illustrative purposes only and does not represent the performance of any specific security. Past performance cannot guarantee future results. |
||||||||||||||||||||||||||||||||
Stock Markets Produce Very Solid ReturnsFriday brought the end of the week, the end of the month and the end of the 1st quarter. Looking at just the weekly returns, the major equity indices delivered very solid gains, despite it being a mostly quiet week in terms of economic data and news. When the week was over, it was the smaller-caps outperforming the larger caps as the Russell 2000 posted a big gain relative to the healthy gain for the DJIA. Further, value stocks outperformed growth stocks by a little bit, as West Texas Intermediate prices leapt more than 9% to close north of $70/barrel.
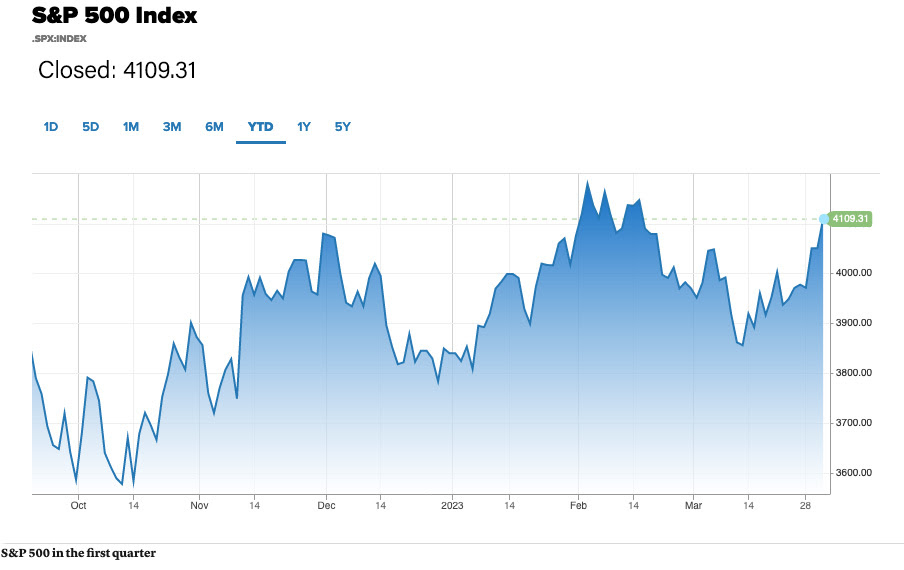
And while equity investors were happy to end the week on an up note, the big news was that the tech-heavy NASDAQ rose more than 16% for the first quarter, whereas the S&P 500 moved up 7%. But the even bigger news was that the four major indices crossed into positive territory for the YTD and three of the four crested a purely-psychological threshold as:
Of the economic news received this week, most was mixed, including that:
GDP Up 2.6% in 4th Quarter of 2022On Thursday, the Bureau of Economic Analysis reported that real gross domestic product increased at an annual rate of 2.6% in the fourth quarter of 2022. For perspective, in the third quarter, real GDP increased 3.2%. This is the “third” GDP estimate released and it is based on more complete source data than were available for the “second” estimate issued last month. In the second estimate, the increase in real GDP was 2.7%. The revision primarily reflected downward revisions to exports and consumer spending. Imports, which are a subtraction in the calculation of GDP, were revised down.
“The increase in real GDP primarily reflected increases in private inventory investment, consumer spending, nonresidential fixed investment, federal government spending, and state and local government spending that were partly offset by decreases in residential fixed investment and exports. Imports decreased. The increase in private inventory investment was led by manufacturing (mainly petroleum and coal products) as well as mining, utilities, and construction (led by utilities). The increase in consumer spending reflected an increase in services that was partly offset by a decrease in goods. Within services, the increase was led by health care as well as housing and utilities. Within goods, the leading contributor to the decrease was “other” durable goods (mainly jewelry). Within nonresidential fixed investment, increases in structures and intellectual property products (mainly software) were partly offset by a decrease in equipment. The increase in federal government spending was led by nondefense spending. The increase in state and local government spending primarily reflected an increase in the compensation of state and local government employees. Within residential fixed investment, the leading contributors to the decrease were new single-family construction and brokers’ commissions. Within exports, a decrease in goods (led by nondurable goods excluding petroleum) was partly offset by an increase in services (led by travel as well as transport). Within imports, both goods (led by durable consumer goods) and services (led by transport) decreased.” Pending Home Sales Index UpThe National Association of Realtors reported that “Pending Home Sales” grew in February for the third consecutive month. Further, three U.S. regions posted monthly gains, while the West declined — but all four regions saw year-over-year decreases in transactions. The Pending Home Sales Index – a forward-looking indicator of home sales based on contract signings – improved 0.8% to 83.2 in February. Year-over-year, pending transactions dropped by 21.1%. An index of 100 is equal to the level of contract activity in 2001. “After nearly a year, the housing sector’s contraction is coming to an end. Existing-home sales, pending contracts and new-home construction pending contracts have turned the corner and climbed for the past three months.”
|

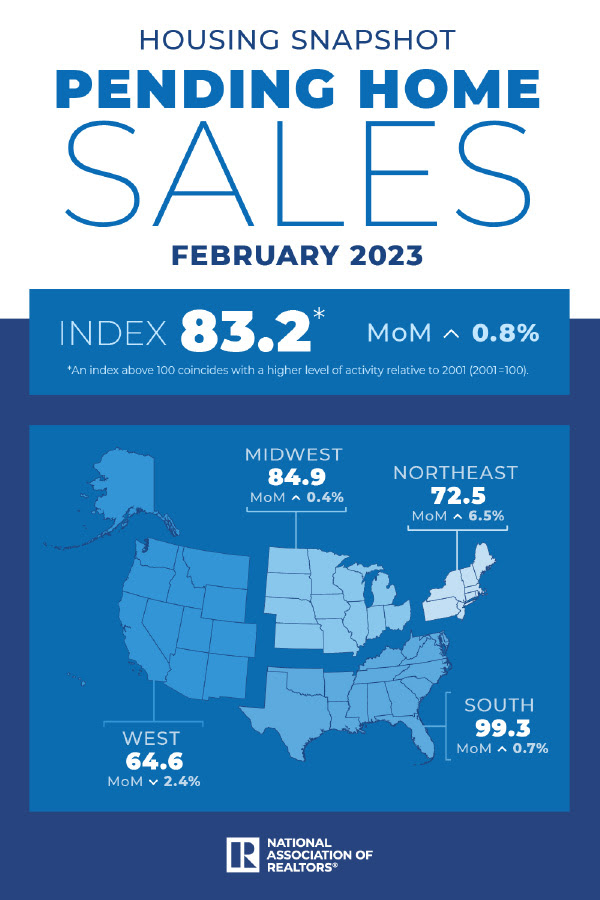 “The affordable U.S. regions — the Midwest and South — are leading the recovery. Mortgage rates have improved in recent weeks after the federal government guaranteed the status of most mortgages amidst uncertainty in the financial market. While access to commercial mortgage loans could become increasingly difficult, residential mortgage loans are expected to be more readily available.”
Modest Growth in Texas Manufacturing But Outlook Worsens
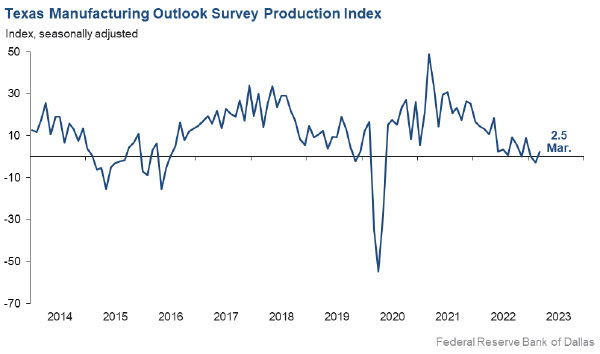
On Monday, the Dallas Fed reported that “Texas factory activity expanded slightly in March after contracting in February. The production index, a key measure of state manufacturing conditions, moved up from -2.8 to 2.5, a reading suggestive of a modest increase in output.”
Further, other measures of manufacturing activity showed mixed signals this month, including:
- The new orders index was negative for a 10th month in a row and came in at -14.3, little changed from February.
- The growth rate of orders index was also negative and largely unchanged, at -15.2.
- The capacity utilization index returned to positive territory, moving up six points to 2.3.
- The shipments index pushed down from -5.0 to -10.5.
Perceptions of broader business conditions continued to worsen in MarchThe general business activity index slipped two points to -15.7. The company outlook index remained negative but rose four points to -13.3. The outlook uncertainty index came in at 22.0, down slightly from February but still elevated. Labor market measures suggest a resumption of employment growth and continued lengthening of workweeks. The employment index shot up 11 points to 10.4 after dipping below zero last month. Twenty-four percent of firms noted net hiring, while 14 percent noted net layoffs. The hours worked index edged down to 2.6, a reading slightly below average. Price and wage pressures receded in March, though wage growth remained elevated relative to average. The raw materials prices index retreated five points to 20.3, falling further below its series average of 27.9. The finished goods prices index dropped from 15.8 to 7.0, falling below its series average of 9.0 for the first time since 2020. The wages and benefits index inched down two points to 30.5. Expectations regarding future manufacturing activity were mixed in March. The future production index remained positive but fell eight points to 13.5, signaling well-below-average output growth is expected over the next six months. The future general business activity index pushed further negative, from -2.9 to -11.2. Most other measures of future manufacturing activity remained positive but moved lower this month. |
|
Sources dallasfed.org; nar.realtor; bea.gov; msci.com; fidelity.com; nasdaq.com; wsj.com; morningstar.com;
✅ BOOK AN APPOINTMENT TODAY: https://calendly.com/tdwealth =========================================================== 🔴 SEE ALL OUR LATEST BLOG POSTS: https://tdwealth.net/articles If you like the content, smash that like button! It tells YouTube you were here, and the Youtube algorithm will show the video to others who may be interested in content like this. So, please hit that LIKE button!💥 🎯🎯🎯Don’t forget to SUBSCRIBE here: https://www.youtube.com/channel/UChmBYECKIzlEBFDDDBu-UIg ✅ Contact me: TDavies@TDWealth.Net 🔥🔥🔥 ====== ===Get Our FREE GUIDES ========== 🔥🔥🔥 🎯Retirement Income: The Transition into Retirement: https://davieswealth.tdwealth.net/retirement-income-transition-into-retirement 🎯Beginner’s Guide to Investment Basics: https://davieswealth.tdwealth.net/investing-basics ✅ LET’S GET SOCIAL Facebook: https://www.facebook.com/DaviesWealthManagement Twitter: https://twitter.com/TDWealthNet Linkedin: https://www.linkedin.com/in/daviesrthomas Youtube Channel: https://www.youtube.com/c/TdwealthNetWealthManagement Lat and Long 27.17404889406371, -80.24410438798957 Davies Wealth Management 684 SE Monterey Road Stuart, FL 34994 772-210-4031 DISCLAIMER **Davies Wealth Management makes content available as a service to its clients and other visitors, to be used for informational purposes only. Davies Wealth Management provides accurate and timely information, however you should always consult with a retirement, tax, or legal professionals prior to taking any action. |
“`
This content is for educational purposes only and does not constitute investment advice. Past performance is not indicative of future results. Advisory services offered through Davies Wealth Management, a Registered Investment Adviser. Please consult a qualified financial, tax, or legal professional regarding your specific situation.
“`
**Summary of links added:**
1. **Retirement Income link** (https://tdwealth.net/retirement/) — Added as anchor text “Retirement Income” in the FREE GUIDES
Leave a Reply