

EQUITY MARKETS MIXED AS EARNINGS SEASON GETS IN FULL SWING AND VOLATILITY HITS LOWEST LEVEL SINCE LATE 2021
Weekly Market Update — April 22, 2023 |

|
Weekly Market Performance
*Source: Bonds represented by the Bloomberg Barclays US Aggregate Bond TR USD. This chart is for illustrative purposes only and does not represent the performance of any specific security. Past performance cannot guarantee future results. |
||||||||||||||||||||||||||||||||
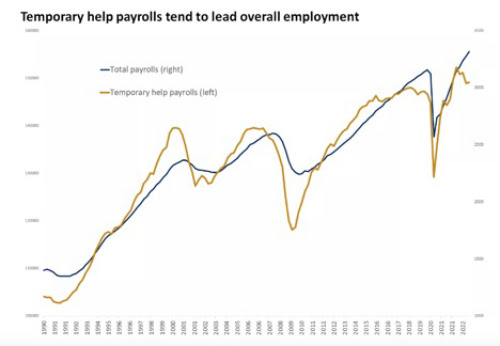
Stock Markets Essentially Trade Sideways This WeekThe major U.S. equity benchmarks ended the week mixed, with the DJIA snapping its consecutive string of positive returns at 4. There was relatively little economic data to digest, but there were plenty of first-quarter earnings reports to parse through. And interestingly, the CBOE Volatility Index, Wall Streets “fear index,” fell to its lowest level since late 2021. Investing in the stock market spent most of the week moving among very tight ranges, and ended up with modest losses, except for the smaller-cap Russell 2000 which managed a modest gain. Generally speaking, earnings results have been better than expected, but next week will be a big test as some big names report. As such, it was as if Wall Street was holding its breath this week and waiting to see what next week might bring, as trading was unusually light this week too. Reviewing the week’s economic data:
|
 |
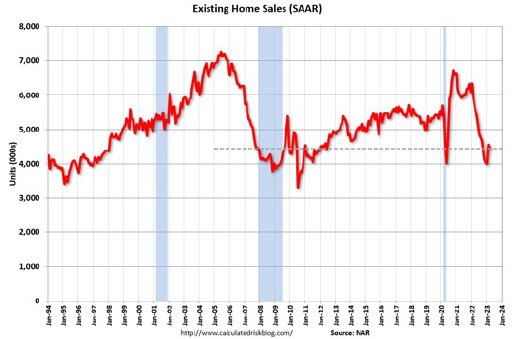
Existing Home Sales Off in MarchExisting-home sales edged lower in March, according to the National Association of Realtors. Month-over-month sales declined in three out of four major U.S. regions, while sales in the Northeast remained steady. All regions posted year-over-year decreases.
|
Regional Breakdown
|
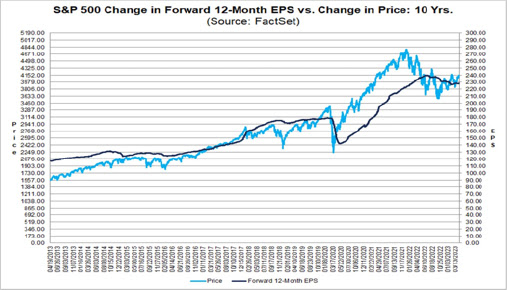
Earnings Season is a Mixed BagAccording to Friday’s press release from research firm FactSet:
|
 |
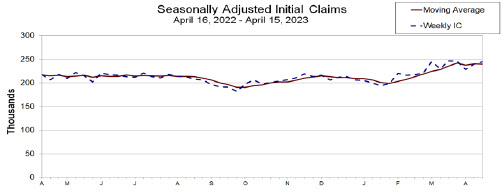
Jobless Claims IncreaseThe Department of Labor reported that initial claims was 245,000, an increase of 5,000 from the previous week’s revised level. Further, the 4-week moving average was 239,750, a decrease of 500 from the previous week’s revised average.
|
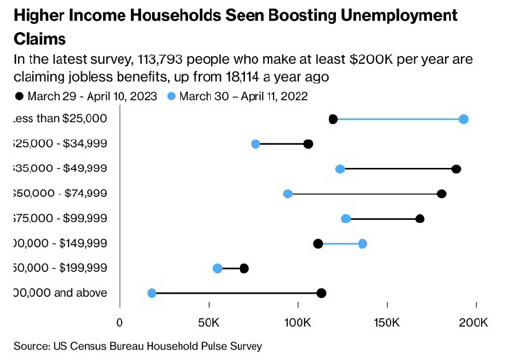
In addition, Bloomberg reports that top earners collecting unemployment benefits have surged 500% in the last year.
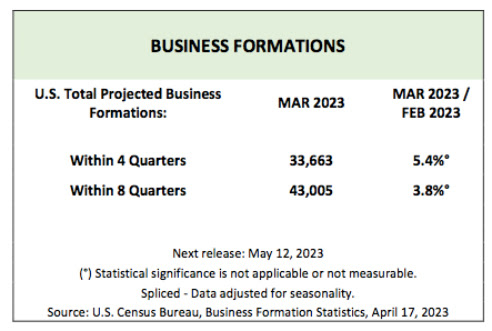
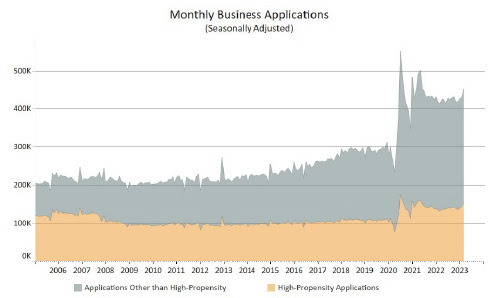
Business Applications Up 4.5% and Business Formations Up 5.4%
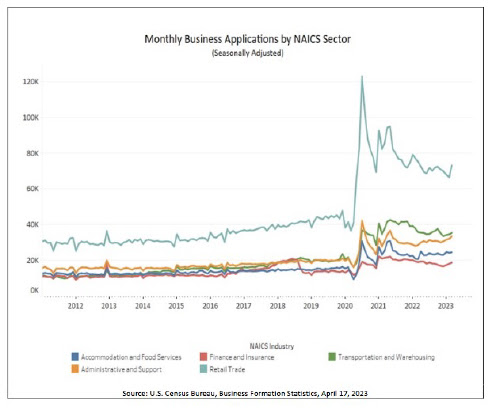
The U.S. Census Bureau announced the following seasonally adjusted business application and formation statistics for March 2023.
Business Applications
Business Applications for March 2023 were 451,752, an increase of 4.5% compared to February 2023.
Business FormationsProjected Business Formations (within 4 quarters) for March 2023 were 33,663, an increase of 5.4% compared to February 2023. The projected business formations are forward looking, providing an estimate of the number of new business startups that will appear from the cohort of business applications in a given month. It does not provide an estimate of the total number of business startups that appeared within a specific month. In other words, the Census Bureau is projecting that 33,663 new business startups with payroll tax liabilities will form within 4 quarters of application from all the business applications filed during March 2023. The 5.4% increase indicates that for March 2023 there will be 5.4% more businesses projected to form within 4 quarters of application, compared to the analogous projections for February 2023.
|
|
Sources nar.realtor ;dol.gov;census.gov;factset. |
✅ BOOK AN APPOINTMENT TODAY: https://calendly.com/tdwealth
===========================================================
🔴 SEE ALL OUR LATEST BLOG POSTS: https://tdwealth.net/articles
If you like the content, smash that like button! It tells YouTube you were
This content is for educational purposes only and does not constitute investment advice. Past performance is not indicative of future results. Advisory services offered through Davies Wealth Management, a Registered Investment Adviser. Please consult a qualified financial, tax, or legal professional regarding your specific situation.
Leave a Reply