MARKETS MIXED AS GROWTH AND TECH NAMES JUMP ON HOPES THAT THE FED MIGHT HAVE REACHED AN INFLECTION POINT ON HIKING RATES


Weekly Market Update — March 18, 2023

Markets

  • This week was dominated by banking worries that started with the collapse of Silicon Valley Bank last week and spread to Signature Bank of New York and a few others this week
  • But before markets opened on Monday, Wall Street learned through a joint statement from the Federal Reserve, Treasury, and the FDIC that all depositors at SVB and Signature Bank would be able to access deposits on Monday, despite being taken over by regulators
  • When Friday’s final Wall Street bell rung, equity returns were mixed, as the small-cap Russell 2000 lost 2.6%, pushing it into the red for the year (YTD: -2.0%) and the mega-cap DJIA lost 0.1%, pushing it further into the red for the year (YTD: -3.9%)
  • The tech-heavy NASDAQ, on the other hand, leapt an astonishing 4.4%, as investors hoped that the Fed’s rate hiking might slow down or be over for the year
  • The large-cap S&P 500 inched up 1.4% and is positive for the year (YTD: +2.0%)
  • Of the 11 S&P 500 sectors, 6 were positive, with the growth sectors, especially Communication Services (+6.9%) and Information Technology (+5.7%), outpacing the defensive sectors like Utilities (+3.9%) and Consumer staples (+1.3%)
  • The 2-year Treasury yield sank 77 basis points to 3.82% and the 10-year Treasury note yield fell 29 basis points to 3.40%
  • Oil prices dropped 13.5% this week to $66.33/barrel, the lowest level since December 2021


Weekly Market Performance

Close Week YTD
DJIA 31,862 -0.1% -3.9%
S&P 500 3,917 +1.4% +2.0%
NASDAQ 11,631 +4.4% +11.0%
Russell 2000 1,726 -2.6.% -2.0%
MSCI EAFE 1,986 -3.5% +2.2%
*Bond Index 2,090.71 +1.75% +2.04%
10–Year Treasury Yield 3.41% -0.29% -0.5%

*Source: Bonds represented by the Bloomberg Barclays US Aggregate Bond TR USD. This chart is for illustrative purposes only and does not represent the performance of any specific security. Past performance cannot guarantee future results.


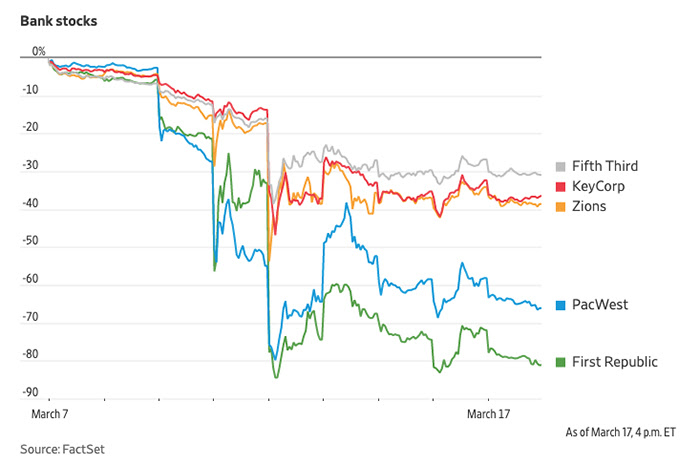
Markets Mixed as Bank-Failure-Worries Ease

It was another volatile week for equity markets around the world, as pressures mounted on the banking sector as concerns grew after the failures of Silicon Valley Bank and Signature Bank and worries at First Republic Bank and Credit Suisse.

And while pundits were quick to call attention to the big bank failures of 2008/2009, this week was different as governments (including the Fed, the Federal Deposit Insurance Corporation, and the Treasury Department) and other well-capitalized banks stepped in quickly to put worries at ease.

BANKS

Then as bond yields dropped swiftly, equities rebounded, giving investors a good case of whiplash. When the week ended, the major U.S. equity indices finished mixed, as the current banking worries might ultimately end up as an inflection point where the Fed slows down or even pauses future rate hikes this year.

Not surprisingly, the 11 S&P 500 sectors varied markedly, with 5 of the 11 ending the week in the red. Specifically, Communication Services (+6.9%) and Information Technology (+5.7%) made big weekly jumps and Financials (-4.9%) and Energy (-6.9%) struggled with big losses. The range in sector returns was further underscored as Large Growth outperformed Large Value by almost 6%.

CHART1

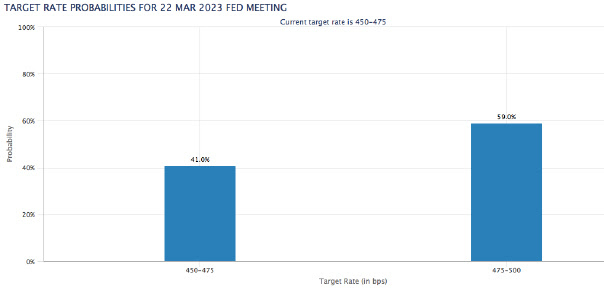
While the bank failures were unpleasant, glass-half-full investors were hopeful that the Fed might adjust its monetary policy and not raise rates by as much. By the end of the week, the fed fund futures markets were pricing in zero likelihood of a 50-basis-point hike versus a 40% chance just one week ago and an almost 40% chance of no rate hike at the Fed’s upcoming meeting on March 21st.

CHART 2

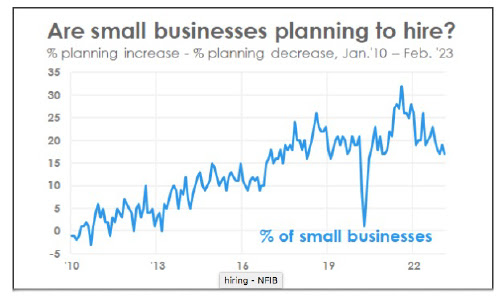
While it seemed everyone was focused on the latest banking news, there was a lot of economic data this week too, including:

  • The Consumer Price Index was was up 0.4% month-over-month in February, and up 6.0% year-over-year, which was the smallest 12-month increase since September 2021
  • Core CPI, which excludes food and energy, was up 0.5% month-over-month and up 5.5% year-over-year, which was the smallest 12-month increase since December 2021
  • The February NFIB Small Business Optimism Index came in at 90.9
  • Weekly MBA Mortgage Applications Index were up 6.5%
  • February Retail Sales were down 0.4%
  • February Retail Sales ex-autos were down 0.1%
  • February PPI was down 0.1%
  • February Core PPI was flat at 0.0%
  • January Business Inventories were down 0.1%
  • Weekly Initial Claims came in at 192,000
  • February Import Prices were down 0.1%
  • February Export Prices were up 0.2%
  • Leading Indicators fell 0.3% in February
  • The preliminary University of Michigan Consumer Sentiment Index for March dropped to 63.4

CHART 3

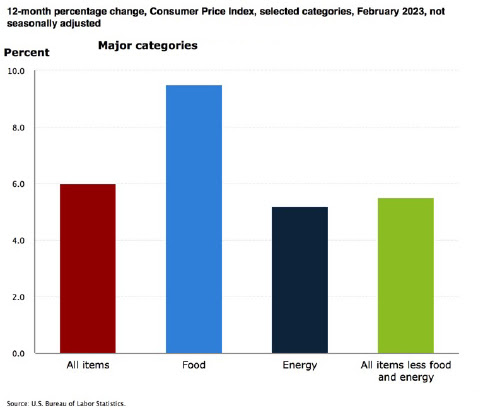
Consumer Price Index Records Smaller Increase, But Food Index is Up 9.5% Over the Last Year

On Tuesday, the U.S. Bureau of Labor Statistics reported that the Consumer Price Index for All Urban Consumers rose 0.4% in February, after increasing 0.5% in January. Over the last 12 months, the all items index increased 6.0% before seasonal adjustment.


CHART 4

Specifically:

  • The index for shelter was the largest contributor to the monthly all items increase, accounting for over 70% of the increase, with the indexes for food, recreation, and household furnishings and operations also contributing.
  • The food index increased 0.4% over the month with the food at home index rising 0.3%.
  • The energy index decreased 0.6% over the month as the natural gas and fuel oil indexes both declined.
  • Categories which increased in February include shelter, recreation, household furnishings and operations, and airline fares.
  • The index for used cars and trucks and the index for medical care were among those that decreased over the month.

Inflation Over the Past 12-Month

The all items index increased 6.0% for the 12 months ending February; this was the smallest 12-month increase since the period ending September 2021.

  • The all items less food and energy index rose 5.5% over the last 12 months, its smallest 12-month increase since December 2021.
  • The energy index increased 5.2% for the 12 months ending February.
  • The food index increased 9.5% over the last year.

Food Index

  • The food index increased 0.4% in February, and the food at home index rose 0.3% over the month. Five of the six major grocery store food group indexes increased over the month. The index for nonalcoholic beverages increased 1.0% in February, after a 0.4% increase the previous month. The indexes for other food at home and for cereals and bakery products each rose 0.3% over the month. The index for fruits and vegetables increased 0.2% in February, and the index for dairy and related products rose 0.1%.
  • In contrast, the meats, poultry, fish, and eggs index fell 0.1 percent over the month, the first decrease in that index since December 2021. The index for eggs fell 6.7% in February following sharp increases in recent months.

Nearly Half of Small Businesses Have Job Openings They Can’t Fill

Early in the week, the National Federation of Independent Businesses reported that 47% of small business owners reported job openings they could not fill in the current period.

Specifically, “[t]he percent of small business owners reporting labor quality as their top small business operating problem remains elevated at 21%, down three points from January. Labor cost reported as the single most important problem to business owners increased two points to 12%, down one point below the highest reading of 13% reached in December 2021.

A seasonally adjusted net 17% of owners are planning to create new jobs in the next three months, down two points from January and 15 points below its record high reading of 32 reached in August 2021, showing that the trend in planned hiring is on the decline.

Sixty percent of owners reported hiring or trying to hire in January, up three points from January. Of those hiring or trying to hire, 90% of owners reported few or no qualified applicants for the positions they were trying to fill. Thirty percent of owners reported few qualified applicants for their open positions.”


CHART 5

Further:

  • 46% of owners reported raising compensation, unchanged from last month.
  • 23% plan to raise compensation in the next three months, up one point from January.
  • 38% of owners have job openings for skilled workers.
  • 19% have openings for unskilled labor.
CHART 5

Sources

bls.gov;nfib.com;msci.com;fidelity.com;nasdaq.com;wsj.commorningstar.com;


✅ BOOK AN APPOINTMENT TODAY: https://calendly.com/tdwealth

===========================================================

🔴 SEE ALL OUR LATEST BLOG POSTS: https://tdwealth.net/articles

If you like the content, smash that like button! It tells YouTube you were here, and the Youtube algorithm will show the video to others who may be interested in content like this. So, please hit that LIKE button!💥

🎯🎯🎯Don’t forget to SUBSCRIBE here: https://www.youtube.com/channel/UChmBYECKIzlEBFDDDBu-UIg

✅ Contact me: TDavies@TDWealth.Net

🔥🔥🔥 ====== ===Get Our FREE GUIDES  ========== 🔥🔥🔥

🎯Retirement Income: The Transition into Retirement: https://davieswealth.tdwealth.net/retirement-income-transition-into-retirement

🎯Beginner’s Guide to Investing Basics: https://davieswealth.tdwealth.net/investing-basics

✅ LET’S GET SOCIAL

Facebook: https://www.facebook.com/DaviesWealthManagement

Twitter: https://twitter.com/TDWealthNet

Linkedin:  https://www.linkedin.com/in/daviesrthomas

Youtube Channel: https://www.youtube.com/c/TdwealthNetWealthManagement

Lat and Long

27.17404889406371, -80.24410438798957

Davies Wealth Management

684 SE Monterey Road

Stuart, FL 34994

772-210-4031

https://TDWealth.Net

DISCLAIMER

**Davies Wealth Management makes content available as a service to its clients and other visitors, to be used for informational purposes only. Davies Wealth Management provides accurate and timely information, however you should always consult with a retirement, tax, or legal professionals prior to taking any action.