

MARKETS RETREAT SIGNIFICANTLY AS THE FED TALKS AND SILICON VALLEY BANK GOES INTO RECEIVERSHIP, PUSHING FINANCIALS DOWN FINANCIALS
Weekly Market Update — March 11, 2023
- Stocks had a terrible week as Wall Street parsed through Fed Chair Jerome Powell’s testimony, employment numbers came in too strong and SVB Financial’s Silicon Valley Bank was shut down and put into receivership
- When Friday’s bell finally rung, equities across the board were hit hard, especially the smaller-caps, as the Russell 2000 lost 8.1% and now stands a whisper above water for the YTD at +0.7%
- The other three major U.S. indices all lost over 4%, as the tech-laden NASDAQ (-4.7%), the large-cap S&P 500 (-4.5%) and the mega-cap DJIA (-4.4%) all were hit hard, as the DJIA turned in its worst weekly performance since last June
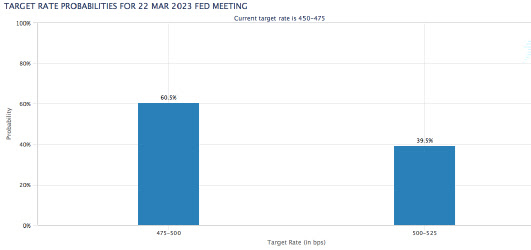
- The equities market wobbled after Fed Chair Powell’s remarks as Wall Street is now rethinking that the March meeting of the Fed will bring a 50 basis point rate hike
- But markets took a severe downturn when news broke late in the week that SVB Financial was seeking to raise capital and then on mid-day Friday, it was announced that its Silicon Valley Bank was being shut down by the FDIC
- The 2-year Treasury note dropped to 4.59% while the 10-year yield dropped 26 basis points to 3.70%
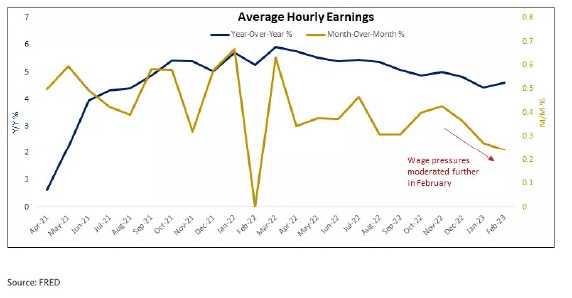
- The February employment report on Friday showed stronger than expected nonfarm payrolls and weaker than expected average hourly earnings growth
- Not surprisingly, every single one of the 11 S&P 500 sectors lost money, with Financials getting hit the hardest with a drop of 8.5%
- But other sectors were hit hard too, notably a 7.6% decline in Materials and a 7.0% drop in Real Estate
- The best performing sector this week was Consumer Staples, which still lost 1.9%
Weekly Market Performance
| Close | Week | YTD | |
| DJIA | 31,910 | -4.4% | -3.7% |
| S&P 500 | 3,862 | -4.5% | +0.6% |
| NASDAQ | 11,139 | -4.7% | +6.4% |
| Russell 2000 | 1,773 | -8.1.% | +0.7% |
| MSCI EAFE | 2,052 | -0.8% | +5.7% |
| *Bond Index | 2,054.63 | +0.08% | +0.29% |
| 10–Year Treasury Yield | 3.70% | -0.26% | -0.3% |
*Source: Bonds represented by the Bloomberg Barclays US Aggregate Bond TR USD. This chart is for illustrative purposes only and does not represent the performance of any specific security. Past performance cannot guarantee future results.
Markets Crater As the 2nd Largest Bank Failure Happens
Equities had a really rough week, as investors struggled to best understand Fed Chair Jerome Powell’s testimony before Congress and looked for a signal as to whether the Fed intends to raise rates faster and higher in the coming months.

Wall Street and Main Street seemed really focused on these remarks from Powell:
“Although inflation has been moderating in recent months, the process of getting inflation back down to 2 percent has a long way to go and is likely to be bumpy. As I mentioned, the latest economic data have come in stronger than expected, which suggests that the ultimate level of interest rates is likely to be higher than previously anticipated. If the totality of the data were to indicate that faster tightening is warranted, we would be prepared to increase the pace of rate hikes. Restoring price stability will likely require that we maintain a restrictive stance of monetary policy for some time.”
As soon as Powell spoke the Fed funds futures market leapt to an almost 80% probability of a 50 basis point rate hike and equities struggled, especially the Financials sector.
Then it got worse. A lot worse.
On Thursday news circulated that SVB Financial was seeking to raise capital. And then around noon on Friday, it was announced that their Silicon Valley Bank was being shut down by the FDIC. That news pushed investors to the safety of Treasuries and there was heavy selling as traders took risk off the table.

The Silicon Valley Bank failure rocked the tech industry and sent tremors throughout Wall Street as it largely serves start-ups and venture capitalists. Those with deposits at the bank – namely start-up founders and venture capitalists – worried that money needed to pay employees is frozen or worse, lost.
The only (maybe) good news is that the fed funds future market retreated in its prediction of the next rate hike later in March.
During all of this, there was a ton of economic data reported, especially within the labor market, including that:
- February employment report showed stronger than expected nonfarm payrolls and weaker than expected average hourly earnings growth
- January Factory Orders declined 1.6% month-over-month in January following a downwardly revised 1.7% increase in December
- Shipments of manufactured goods increased 0.7% month-over-month after declining 0.6% in December
- January Wholesale Inventories were down 0.4% month-over-month, as expected, following a 0.1% increase in December
- Consumer credit increased by $14.8 billion in January
- The weekly MBA Mortgage Application Index rose 7.4% with refinancing applications increasing 9.0% and purchase applications rising 7.0%
- The ADP Employment Change showed that private payrolls rose by 242,000
- The trade deficit for January widened to $68.3 billion as imports were $9.6 billion more than December imports and exports were $8.5 billion more than December exports
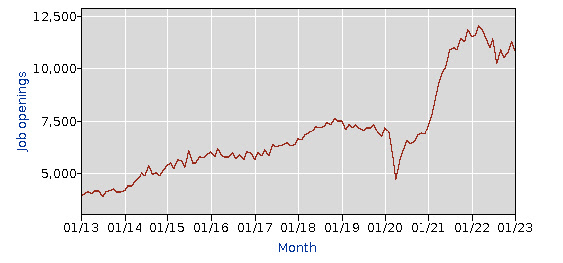
- Job Openings totaled 10.824 million in January
- Initial jobless claims for the week ending March 4 increased by 21,000 to 211,000 – the highest claims levels since December
- February Unemployment Rate hit 3.6%
Job Openings and Quits Decrease, Layoffs Increase
On Wednesday, the U.S. Bureau of Labor Statistics reported that the number of job openings decreased to 10.8 million. Further, over the month, the number of hires and total separations changed little at 6.4 million and 5.9 million, respectively. Within separations, quits (3.9 million) decreased, while layoffs and discharges (1.7 million) increased.
Job Openings
On the last business day of January:
- The number and rate of job openings decreased to 10.8 million, down 6.5%.
- The largest decreases in job openings were in construction (-240,000), accommodation and food services (-204,000), and finance and insurance (-100,000).
- The number of job openings increased in transportation, warehousing, and utilities (+94,000) and in nondurable goods manufacturing (+50,000).
Separations
- In January, the number of total separations changed little at 5.9 million. The rate was unchanged at 3.8%
- .
- The number of total separations decreased in federal government (-13,000).
- In January, the number of quits decreased to 3.9 million (-207,000), and the rate was little changed at 2.5%.
- Quits decreased in professional and business services (-221,000), educational services (-14,000), and federal government (-5,000).
- In January, the number of layoffs and discharges increased to 1.7 million (+241,000).
- The rate was little changed at 1.1%.
- Layoffs and discharges increased in professional and business services (+190,000) but decreased in federal government (-5,000).
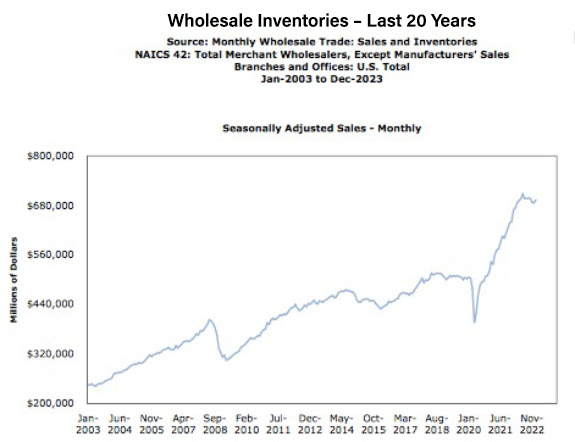
U.S. Wholesale Inventories Fell in January for the First Time Since July 2020 But Up 15.8% Since January 2022
On Tuesday, the U.S. Census Bureau announced the following new wholesale trade statistics for January 2023:
Sales
- January 2023 sales of merchant wholesalers, except manufacturers’ sales branches and offices, were $693.8 billion, up 1.0% from the December level and up 3.6% from the January 2022 level.
- The November 2022 to December 2022% change was revised from the preliminary estimate of virtually unchanged to down 0.2%.
Inventories
- Total inventories of merchant wholesalers, except manufacturers’ sales branches and offices were $929.0 billion at the end of January, down 0.4% from the December level.
- Total inventories were up 15.8% from the January 2022 level.
- The December 2022 to January 2023% change was unrevised from the advance estimate of down 0.4%
.
Inventories/Sales Ratio
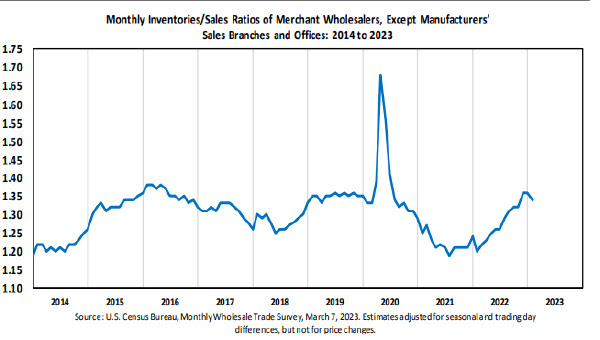
- The January inventories/sales ratio for merchant wholesalers, except manufacturers’ sales branches and offices was 1.34.
- The January 2022 ratio was 1.20.
 |
|
Sources bls.gov; census.gov; msci.com; fidelity.com; nasdaq.com; wsj.com; morningstar.com; |
✅ BOOK AN APPOINTMENT TODAY: https://calendly.com/tdwealth
===========================================================
🔴 SEE ALL OUR LATEST BLOG POSTS: https://tdwealth.net/articles
If you like the content, smash that like button! It tells YouTube you were here, and the Youtube algorithm will show the video to others who may be interested in content like this. So, please hit that LIKE button!💥
🎯🎯🎯Don’t forget to SUBSCRIBE here: https://www.youtube.com/channel/UChmBYECKIzlEBFDDDBu-UIg
✅ Contact me: TDavies@TDWealth.Net
🔥🔥🔥 ====== ===Get Our FREE GUIDES ========== 🔥🔥🔥
🎯Retirement Income: The Transition into Retirement: https://davieswealth.tdwealth.net/retirement-income-transition-into-retirement
🎯Beginner’s Guide to Investment Basics: https://davieswealth.tdwealth.net/investing-basics
✅ LET’S GET SOCIAL
Facebook: https://www.facebook.com/DaviesWealthManagement
Twitter: https://twitter.com/TDWealthNet
Linkedin: https://www.linkedin.com/in/daviesrthomas
Youtube Channel: https://www.youtube.com/c/TdwealthNetWealthManagement
Lat and Long
27.17404889406371, -80.24410438798957
Davies Wealth Management
684 SE Monterey Road
Stuart, FL 34994
772-210-4031
DISCLAIMER
**Davies Wealth Management makes content available as a service to its clients and other visitors, to be used for informational purposes only. Davies Wealth Management provides accurate and timely information, however you should always consult with a retirement, tax, or legal professionals prior to taking any action.
This content is for educational purposes only and does not constitute investment advice. Past performance is not indicative of future results. Advisory services offered through Davies Wealth Management, a Registered Investment
Leave a Reply