NASDAQ TURNS IN ANOTHER HOT WEEK AS THE OTHER EQUITY MARKETS STRUGGLE AMIDST DEBT CEILING WORRIES AND FED-HIKE CONCERNSWeekly Market Update — May 27, 2023 |
||||||||||||||||||||||||||||||||
|
||||||||||||||||||||||||||||||||
Weekly Market Performance
*Source: Bonds represented by the Bloomberg Barclays US Aggregate Bond TR USD. This chart is for illustrative purposes only and does not represent the performance of any specific security. Past performance cannot guarantee future results. |
||||||||||||||||||||||||||||||||
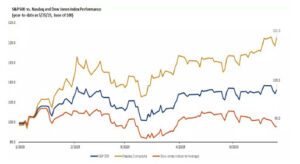
Equities Mixed This Week Ahead of Long Holiday WeekendThe major U.S. equity indices had a mixed week, as the tech-laden NASDAQ jumped 2.5%, far outpacing the tiny gain from the large-cap S&P 500 (+0.3%), the decline of the mega-cap DJIA (-1.0%) and the flatness of the smaller-cap Russell 2000 (-0.0%). Maybe more interesting is that after this week’s close, the DJIA inched into negative territory for the YTD (-0.2%) whereas NASDAQ is up a staggering 24.0%. The theme of the week was uncertainty surrounding debt ceiling negotiations, with Wall Street parsing through every speech hoping for a sign of progress in negotiation the debt ceiling by June 1st. There was a lot of economic data to digest this week, including that:
Markets will be closed on Monday, May 29th, in observance of Memorial Day. |
||||||||||||||||||||||||||||||||
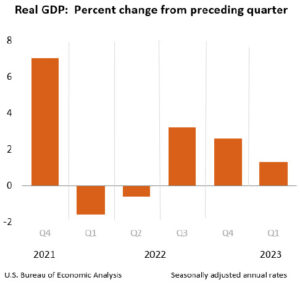
First Quarter 2023 GDP Revised Up“Real gross domestic product increased at an annual rate of 1.3% in the first quarter of 2023, according to the “second” estimate released by the Bureau of Economic Analysis. In the fourth quarter, real GDP increased 2.6%. The GDP estimate is based on more complete source data than were available for the “advance” estimate issued last month. In the advance estimate, the increase in real GDP was 1.1%. The updated estimates primarily reflected an upward revision to private inventory investment. The increase in real GDP reflected increases in consumer spending, exports, federal government spending, state and local government spending, and nonresidential fixed investment that were partly offset by decreases in private inventory investment and residential fixed investment. Imports, which are a subtraction in the calculation of GDP, increased.” |
||||||||||||||||||||||||||||||||
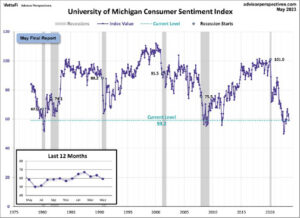
Consumer Sentiment Drops to 6-Month Low“Consumer sentiment slid 7% amid worries about the path of the economy, erasing nearly half of the gains achieved after the all-time historic low from last June. This decline mirrors the 2011 debt ceiling crisis, during which sentiment also plunged. This month, sentiment fell severely for consumers in the West and those with middle incomes. The year-ahead economic outlook plummeted 17% from last month. Long-run expectations plunged by 13% as well, indicating that consumers are concerned that any recession to come may cause lasting pain. That said, consumer views over their personal finances are little changed from April, with stable income expectations supporting consumer spending for the time being.” “Year-ahead inflation expectations receded to 4.2% in May after spiking to 4.6% in April. Uncertainty, as measured by the interquartile range of these expectations has been elevated, averaging 7.8 over the last 12 months, but fell this month to 5.7, the lowest level of uncertainty in almost two years. This suggests that consumer views over short-run inflation may be stabilizing following four months of vacillation. Long-run inflation expectations inched up for the second straight month but remained within the narrow 2.9-3.1% range for 21 of the last 22 months.” |
||||||||||||||||||||||||||||||||
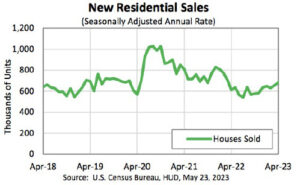
Sales of New Single-Family Houses Are Up While Building Permits Are NotThe U.S. Census Bureau and the U.S. Department of Housing and Urban Development jointly announced the following new residential sales statistics for April 2023:
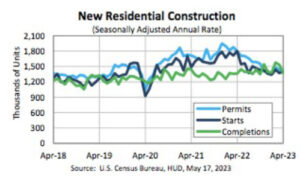
Residential ConstructionThis is on the heels of the following new residential construction statistics for April 2023: Building Permits
Housing Starts
Housing Completions
|
||||||||||||||||||||||||||||||||
| Sources
census.gov; bea.gov; umich,edu; msci.com; fidelity.com; nasdaq.com; wsj.com; morningstar.com; |
✅ BOOK AN APPOINTMENT TODAY: https://calendly.com/tdwealth
===========================================================
🔴 SEE ALL OUR LATEST BLOG POSTS: https://tdwealth.net/articles
If you like the content, smash that like button! It tells YouTube you were here, and the Youtube algorithm will show the video to others who may be interested in content like this. So, please hit that LIKE button!💥
🎯🎯🎯Don’t forget to SUBSCRIBE here: https://www.youtube.com/channel/UChmBYECKIzlEBFDDDBu-UIg
✅ Contact me: TDavies@TDWealth.Net
🔥🔥🔥 ====== ===Get Our FREE GUIDES ========== 🔥🔥🔥
🎯Retirement Income: The Transition into Retirement: https://davieswealth.tdwealth.net/retirement-income-transition-into-retirement
🎯Beginner’s Guide to Investing Basics: https://davieswealth.tdwealth.net/investing-basics
✅ LET’S GET SOCIAL
Facebook: https://www.facebook.com/DaviesWealthManagement
Twitter: https://twitter.com/TDWealthNet
Linkedin: https://www.linkedin.com/in/daviesrthomas
Youtube Channel: https://www.youtube.com/c/TdwealthNetWealthManagement
Lat and Long
27.17404889406371, -80.24410438798957
Davies Wealth Management
684 SE Monterey Road
Stuart, FL 34994
772-210-4031
DISCLAIMER
**Davies Wealth Management makes content available as a service to its clients and other visitors, to be used for informational purposes only. Davies Wealth Management provides accurate and timely information, however you should always consult with a retirement, tax, or legal professionals prior to taking any action.


Leave a Reply