EQUITIES RETREAT AS FED HOLDS RATE STEADY AND AS THE UNITED AUTO WORKERS’ STRIKE ENTERS A NEW WORRISOME PHASEWeekly Market Update — September 23, 2023 |
||||||||||||||||||||||||||||||||
|
||||||||||||||||||||||||||||||||
Weekly Market Performance
*Source: Bonds represented by the Bloomberg Barclays US Aggregate Bond TR USD. This chart is for illustrative purposes only and does not represent the performance of any specific security. Past performance cannot guarantee future results. |
||||||||||||||||||||||||||||||||
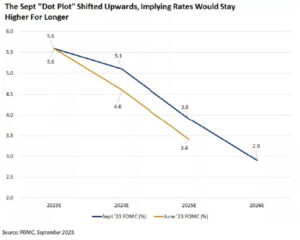
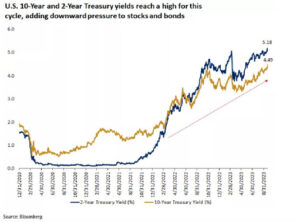
Equities Retreat as Fed Keeps Rates Steady – For NowThe major U.S. equity benchmarks declined again this week as investors toggled between hope that the Fed might be done with its rate-hiking and worry from the Fed’s recent and very hawkish comments from its last meeting. Between worrying about the Fed, rising Treasury yields, worries over the prolonged United Auto Workers strike and the potential for a U.S. government shutdown at the end of the month, Wall Street felt more gloomy and sellers clearly outnumbered buyers. The big news on the week was that the Fed decided to leave its fed funds rate (its short-term lending benchmark) at a target range of 5.25% to 5.50%, the same level established at its July meeting. But confounding Wall Street was the Fed’s updated Summary of Economic Predictions where another rate hike this year was very much on the table. In addition, the Fed surprised many with an outlook for rates next year that were notably higher than expected as were their 2025 rate predictions. And as expected, the notion of the Fed keeping short-term rates higher for longer pushed longer-term U.S. Treasury yields higher, with the benchmark 10-year U.S. Treasury yield hitting a 16-year high. This in turn weighed heavily on equities all week, especially the growth and tech names. There was a decent amount of economic data this week, including that:
|
||||||||||||||||||||||||||||||||
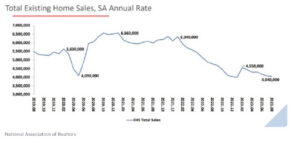
Existing Home Sales DropOn Thursday, the National Association of Realtors reported that existing-home sales moved lower in August and that among the four major U.S. regions, sales improved in the Midwest, were unchanged in the Northeast, and slipped in the South and West. Further, all four regions recorded year-over-year sales declines. Further
|
||||||||||||||||||||||||||||||||
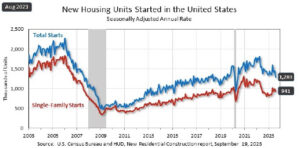
U.S. Homebuilding at 3-Year Low While New Permits IncreaseOn Tuesday, the U.S. Census Bureau reported its August New Monthly Construction data. To summarize: U.S. homebuilding plunged to more than a 3-year-low as high mortgage rates weighed on demand, but a surge in permits suggests new construction is still supported by a demand for homes (or lack of supply). Building Permits
Housing Starts
Housing Completions
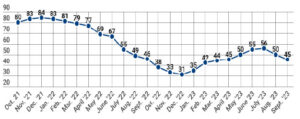
Builder Confidence WanesThis is on the heels of the National Association of Home Builders reporting that: “builder confidence in the market for newly built single-family homes in September fell five points to 45, according to the National Association of Home Builders (NAHB)/Wells Fargo Housing Market Index.” This follows a six-point drop in August. From the NAHB release: “As mortgage rates stayed above 7% over the last month, more builders are reducing home prices again to bolster sales. In September, 32% of builders reported cutting home prices, compared to 25% in August. That’s the largest share of builders cutting prices since December 2022 (35%). The average price discount remains at 6%. Meanwhile, 59% of builders provided sales incentives of all forms in September, more than any month since April 2023.” |
||||||||||||||||||||||||||||||||
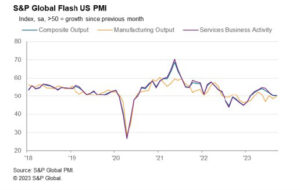
Service Activity Losing MomentumOn Thursday, S&P released its report with the following headline: “Further loss of service sector momentum weighs on overall US economic performance.” The release stated that “US businesses signaled a broad stagnation in output at the end of the third quarter as manufacturers and service providers alike indicated muted demand conditions. September data indicated the worst performance across the private sector since February, as the service economy lost further momentum. New orders fell at the strongest pace this year so far as demand for services slipped further into contractionary territory. Manufacturers also saw a drop in new sales, albeit at a slightly softer pace. Cost pressures ticked higher again, as input prices rose at a marked pace. Nonetheless, the rate of cost inflation was much softer than those seen on average throughout the last three years. Firms continued to pass through higher costs to clients, but weak client interest stymied their ability to hike selling prices as the pace of increase matched that seen in August.” |
||||||||||||||||||||||||||||||||
| Sources
Nar.realtor;census.gov;nahb.org;spglobal.com;msci.com;fidelity.com;nasdaq.com;wsj.com; morningstar.com; |
✅ BOOK AN APPOINTMENT TODAY: https://calendly.com/tdwealth
===========================================================
SEE ALL OUR LATEST BLOG POSTS: https://tdwealth.net/articles
If you like the content, smash that like button! It tells YouTube you were here, and the Youtube algorithm will show the video to others who may be interested in content like this. So, please hit that LIKE button!
Don’t forget to SUBSCRIBE here: https://www.youtube.com/channel/UChmBYECKIzlEBFDDDBu-UIg
✅ Contact me: TDavies@TDWealth.Net
====== ===Get Our FREE GUIDES ==========
Retirement Income: The Transition into Retirement: https://davieswealth.tdwealth.net/retirement-income-transition-into-retirement
Beginner’s Guide to Investing Basics: https://davieswealth.tdwealth.net/investing-basics
✅ LET’S GET SOCIAL
Facebook: https://www.facebook.com/DaviesWealthManagement
Twitter: https://twitter.com/TDWealthNet
Linkedin: https://www.linkedin.com/in/daviesrthomas
Youtube Channel: https://www.youtube.com/c/TdwealthNetWealthManagement
Lat and Long
27.17404889406371, -80.24410438798957
Davies Wealth Management
684 SE Monterey Road
Stuart, FL 34994
772-210-4031
DISCLAIMER
**Davies Wealth Management makes content available as a service to its clients and other visitors, to be used for informational purposes only. Davies Wealth Management provides accurate and timely information, however you should always consult with a retirement, tax, or legal professionals prior to taking any action.


Leave a Reply