STOCK MARKETS COME ROARING BACK DURING BUSY WEEK OF EARNINGS REPORTS AND AS FED LEAVES RATES UNCHANGEDWeekly Market Update — November 4, 2023 |
||||||||||||||||||||||||||||||||
|
||||||||||||||||||||||||||||||||
Weekly Market Performance
*Source: Bonds represented by the Bloomberg Barclays US Aggregate Bond TR USD. This chart is for illustrative purposes only and does not represent the performance of any specific security. Past performance cannot guarantee future results. |
||||||||||||||||||||||||||||||||
Stock Markets Leap as Fed Leaves Rates AloneEquity markets jumped this week as the S&P 500 Index recorded its strongest weekly gain in almost a year and as the smaller-cap Russell 2000 clawed back to break-even YTD with an astonishing weekly gain of +7.6%, its best weekly performance since October of 2022. In addition, NASDAQ’s +6.6% jump and the S&P 500’s +5.9% gain pulled them both out of correction territory. Driving this week’s spectacular gains was the policy statement from the Fed that was perceived as dovish which helped to drive a sharp decrease in long-term bond yields. The Fed left rates steady, as expected, but traders were encouraged by the Fed’s statement, which signaled that the recent runup in long-term Treasury yields had achieved some of Fed’s intended tightening. Wall Street is also not pricing in any more rate hikes over the next year and instead is actually pricing in two rate cuts over the next 12 months, according to the CME FedWatch Tool. Not surprisingly, growth stocks trounced value names, smaller-caps outpaced the larger names and the interest-rate sensitive sectors led all (think Financials and Real Estate). It was a very busy earnings week and some suggested that institutional investors were taking tax losses ahead of the month-end as “window dressing.” There was a ton of economic data this week, including that:
|
||||||||||||||||||||||||||||||||
Global Markets Drop in OctoberTuesday marked the end of the month and stock markets in the U.S. and around the world dropped in October, as the smaller-cap and tech names were hit hardest. Unfortunately, October’s tough performance was very similar to what happened in September and August. Specifically, the S&P 500 marked its third-straight month of declines and is down 9.4% over the last three months, its worst three-month period since April to June 2022 and its longest monthly losing streak since March 2020. And NASDAQ just recorded its worst October performance since 2018 and the tech-heavy index is down more than 11% over the last three months, its worst three-month percentage decline since the August-October period in 2022. And the DJIA just recorded its longest monthly losing streak since March 2020. For the month of October:
|
||||||||||||||||||||||||||||||||
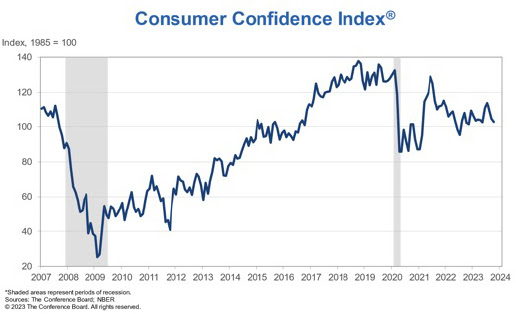
U.S. Consumer Confidence Fell Again in OctoberThe Conference Board Consumer Confidence Index declined moderately in October to 102.6 (1985=100), down from an upwardly revised 104.3 in September.
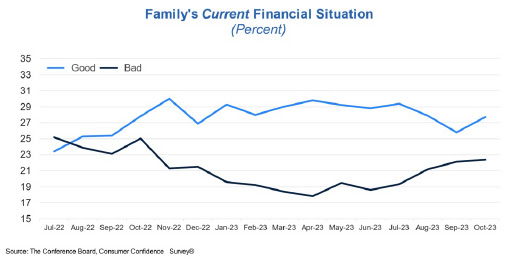
“Consumer confidence fell again in October 2023, marking three consecutive months of decline. October’s retreat reflected pullbacks in both the Present Situation and Expectations Index. Write-in responses showed that consumers continued to be preoccupied with rising prices in general, and for grocery and gasoline prices in particular. Consumers also expressed concerns about the political situation and higher interest rates. Worries around war/conflicts also rose, amid the recent turmoil in the Middle East. The decline in consumer confidence was evident across householders aged 35 and up, and not limited to any one income group.”Consumers’ assessment of their Family’s Current Financial Situation improved slightly in October. Consumers’ Perceived Likelihood of a US Recession over the Next 12 Months remain elevated. |
||||||||||||||||||||||||||||||||
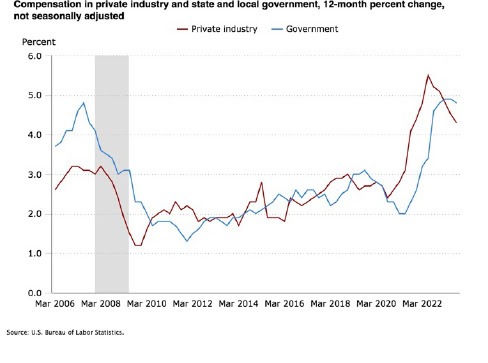
Compensation Costs RiseOn Tuesday, the U.S. Bureau of Labor Statistics reported that compensation costs for civilian workers increased 1.1%, seasonally adjusted, for the 3-month period ending in September 2023. Wages and salaries increased 1.2% and benefit costs increased 0.9% from June 2023. In addition, compensation costs for civilian workers increased 4.3% for the 12-month period ending in September 2023 and increased 5.0% in September 2022. Wages and salaries increased 4.6% for the 12-month period ending in September 2023 and increased 5.1% for the 12-month period ending in September 2022. Benefit costs increased 4.1% over the year and increased 4.9% for the 12-month period ending in September 2022. Among private industry occupational groups, compensation cost increases for the 12-month period ending in September 2023 ranged from 3.9% for production, transportation, and material moving occupations to 4.5% for service occupations. Within industry supersectors, compensation cost increases ranged from 3.7% for manufacturing to 4.9% for both education and health services and for other services, except public administration. Compensation costs for state and local government workers increased 4.8% for the 12-month period ending in September 2023, compared with an increase of 4.6% in September 2022. Wages and salaries increased 4.8% for the 12-month period ending in September 2023 and increased 4.4% a year ago. Benefit costs increased 4.7% for the 12-month period ending in September 2023. The prior year increase was 5.0%. |
||||||||||||||||||||||||||||||||
| Sources
conference-board.org;bls.gov;bea.gov; spglobal.com umich.edu ; factset.com ;msci.com;fidelity.com;nasdaq.com;wsj.com; morningstar.com; |
✅ BOOK AN APPOINTMENT TODAY: https://davieswealth.tdwealth.net/appointment-page
===========================================================
SEE ALL OUR LATEST BLOG POSTS: https://tdwealth.net/articles
If you like the content, smash that like button! It tells YouTube you were here, and the Youtube algorithm will show the video to others who may be interested in content like this. So, please hit that LIKE button!
Don’t forget to SUBSCRIBE here: https://www.youtube.com/channel/UChmBYECKIzlEBFDDDBu-UIg
✅ Contact me: TDavies@TDWealth.Net
====== ===Get Our FREE GUIDES ==========
Retirement Income: The Transition into Retirement: https://davieswealth.tdwealth.net/retirement-income-transition-into-retirement
Beginner’s Guide to Investing Basics: https://davieswealth.tdwealth.net/investing-basics
✅ LET’S GET SOCIAL
Facebook: https://www.facebook.com/DaviesWealthManagement
Twitter: https://twitter.com/TDWealthNet
Linkedin: https://www.linkedin.com/in/daviesrthomas
Youtube Channel: https://www.youtube.com/c/TdwealthNetWealthManagement
Lat and Long
27.17404889406371, -80.24410438798957
Davies Wealth Management
684 SE Monterey Road
Stuart, FL 34994
772-210-4031
#Retirement #FinancialPlanning #wealthmanagement
DISCLAIMER
**Davies Wealth Management makes content available as a service to its clients and other visitors, to be used for informational purposes only. Davies Wealth Management provides accurate and timely information, however you should always consult with a retirement, tax, or legal professionals prior to taking any action.



Leave a Reply