

Here is the full HTML content with internal links added at the first natural occurrence of the keywords:
“`html
EQUITY MARKETS OFF THIS WEEK DESPITE A LATE-WEEK RALLY DRIVEN PRIMARILY BY APPLE AS THE FED RAISES RATES FOR THE 10TH TIMEWeekly Market Update — May 6, 2023 |

|
Weekly Market Performance
*Source: Bonds represented by the Bloomberg Barclays US Aggregate Bond TR USD. This chart is for illustrative purposes only and does not represent the performance of any specific security. Past performance cannot guarantee future results. |
||||||||||||||||||||||||||||||||
Stock Markets Mostly Fall This Week to Kick Off MayU.S. stock markets fell this week, despite a significant end of the week rally driven largely by Apple’s rosy earnings. And not surprisingly, the tech names did outperform the small, large- and mega-cap indices. The Fed was back in the news again and on Wednesday, as it implemented its 10th consecutive rate hike which could be the last hike of this cycle. The Fed raised rates by 25 basis points – its 10th since March 2022 – bringing the fed funds rate to 5.0% – 5.25%. Wall Street is hopeful that we might start to see rate cuts later this year. Those planning to retire may want to consider how this rate environment could affect their long-term financial plans. |

There was a lot of employment data to digest, including that:
Reviewing the remainder of the week’s economic data:
|
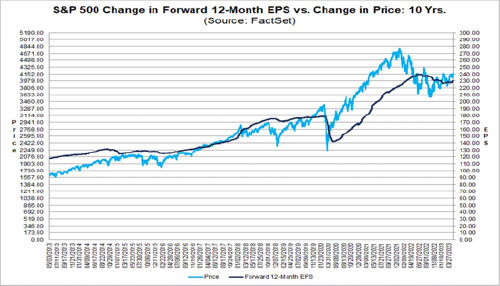
A Very Busy Earnings WeekOn Friday, research firm FactSet reported the following via press release:
|
 |
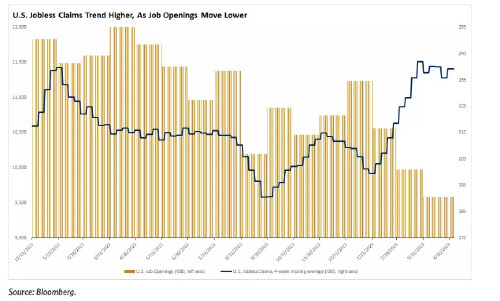
Number of Job Openings Drops for 3rd Month to Lowest Level in 2 YearsThe number of job openings decreased to 9.6 million on the last business day of March, the U.S. Bureau of Labor Statistics. Over the month, the number of hires and total separations were little changed at 6.1 million and 5.9 million, respectively. Within separations, quits (3.9 million) changed little, while layoffs and discharges (1.8 million) increased. This release includes estimates of the number and rate of job openings, hires, and separations for the total nonfarm sector, by industry, and by establishment size class. Job OpeningsOn the last business day of March, the number of job openings decreased to 9.6 million (-384,000) and was 1.6 million lower than in December. The job openings rate was 5.8% in March and was down by 1.0 percentage point since December. In March, job openings decreased in transportation, warehousing, and utilities (-144,000) but increased in educational services (+28,000). |

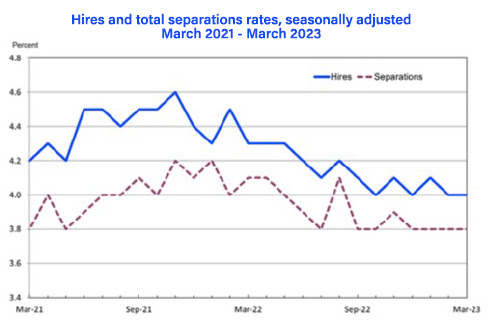
Hires
In March, the number of hires was little changed at 6.1 million, and the rate held at 4.0%. Hires decreased in real estate and rental and leasing (-29,000).
Separations
The number of total separations changed little at 5.9 million in March, and the rate was 3.8% for the fourth month in a row. Over the month, the number of total separations decreased in accommodation and food services (-107,000) but increased in construction (+104,000).
- In March, the number and rate of quits changed little at 3.9 million and 2.5%, respectively. The number of quits decreased in accommodation and food services (-178,000).
- In March, the number and rate of layoffs and discharges increased to 1.8 million (+248,000) and 1.2%, respectively. Layoffs and discharges increased in construction (+112,000), accommodation and food services (+63,000), and health care and social assistance (+42,000).
- The number of other separations was little changed in March at 276,000. Other separations decreased in finance and insurance (-31,000) and in real estate and rental and leasing (-7,000).
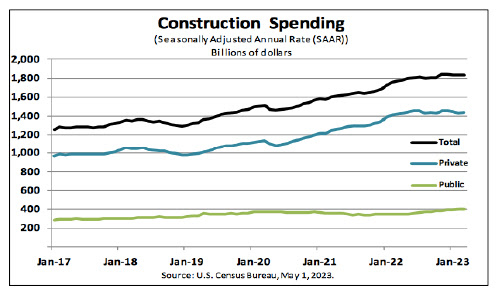
Construction Spending UpAccording to the U.S. Census Bureau, construction spending during March 2023 was at an annual rate of $1,834.7 billion, 0.3% above February. Further, the March figure is 3.8% above the March 2022 figure. And during the first three months of this year, construction spending amounted to $403.3 billion, 4.3% above the $386.7 billion for the same period in 2022.
|
|
Sources bls.gov;census.gov;factset.com
|
✅ BOOK AN APPOINTMENT TODAY: https://calendly.com/tdwealth
===========================================================
🔴 SEE ALL OUR LATEST BLOG POSTS: https://tdwealth.net/articles
If you like the content, smash that like button! It tells YouTube you were here, and the Youtube algorithm will show the video to others who may be interested in content like this. So, please hit that LIKE button!💥
🎯🎯🎯Don’t forget to SUBSCRIBE here: https://www.youtube.com/channel/UChmBYECKIzlEBFDDDBu-UIg
✅ Contact me: TDavies@TDWealth.Net
🔥🔥🔥 ====== ===Get Our FREE GUIDES ========== 🔥🔥🔥
🎯Retirement Income: The Transition into Retirement: https://tdwealth.net/retirement-income-the-transition-into-retirement/
🎯Beginner’s Guide to Investing Basics: https://tdwealth.net/investing-basics/
✅ LET’S GET SOCIAL
Facebook: https://www.facebook.com/DaviesWealthManagement
Twitter: https://twitter.com/TDWealthNet
Linkedin: https://www.linkedin.com/in/daviesrthomas
Youtube Channel: https://www.youtube.com/c/TdwealthNetWealthManagement
Lat and Long
27.17404889406371, -80.24410438798957
Davies Wealth Management
Take the Financial Wellness Quiz
Discover your financial health score in 2 minutes — personalized insights, zero obligation.
Take the QuizDavies Wealth Management · Fee-Based Fiduciary · Stuart, FL
Leave a Reply