EQUITY MARKETS ADVANCE AS THE FED HIKES RATES FOR THE 9TH TIME AND HOUSING COMES ROARING BACK DESPITE RECENT BANK WORRIES
|
Weekly Market Update — March 25, 2023 |

|
Weekly Market Performance
| Close | Week | YTD | |
| DJIA | 32,237 | +1.2% | -2.7% |
| S&P 500 | 3,971 | +1.4% | +3.4% |
| NASDAQ | 11,824 | +1.7% | +13.0% |
| Russell 2000 | 1,734 | +0.5.% | -1.5% |
| MSCI EAFE | 2,017 | +1.5% | +3.7% |
| *Bond Index | 2,117.94 | +1.34% | +3.38% |
| 10–Year Treasury Yield | 3.38% | -0.03% | -0.5% |
*Source: Bonds represented by the Bloomberg Barclays US Aggregate Bond TR USD. This chart is for illustrative purposes only and does not represent the performance of any specific security. Past performance cannot guarantee future results.
Markets Mixed as Fed Hikes Rates Another 25 bps
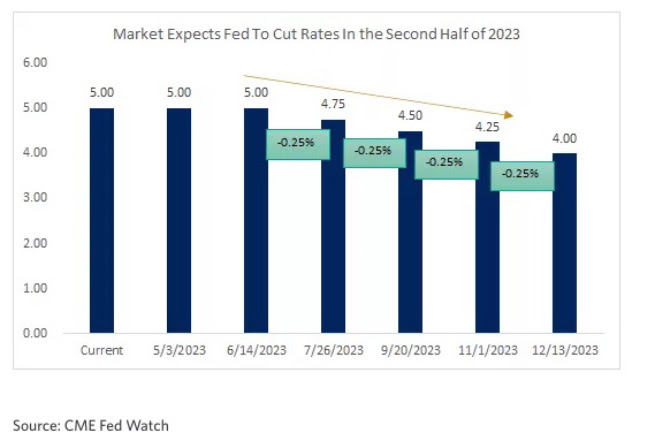
It was another volatile week for equity markets as the banking industry continued to show weak spots, the Fed raised rates by 25 basis points, housing came roaring back and the tech names bounced mightily on hopes that the Fed might actually cut rates later this summer.
The returns for the U.S. equity indices were decently divergent, pushing the tech-laden NASDAQ (+13% YTD) to significantly outperforming the mega-cap DJIA (-2.7% YTD) and the smaller-cap Russell 2000 (-1.5% YTD) by a colossal amount. Worse, the smaller-caps and the mega-caps are solidly negative for the year-to-date.
Not surprisingly, the Financials sector underperformed markedly, as the banking stocks struggled and the Real Estate sector retreated too, despite housing showing a healthy uptick last month. The defensive Utilities sector underperformed on the week too.
There was a ton of economic data this week, including that:
- Existing home sales surged 14.5% month-over-month in February
- Sales increased on a month-over-month basis in February for the first time in 13 months
- The Weekly MBA Mortgage Application Index rose 3.0% with refinancing applications increasing 5.0% and purchase applications rising 2.0%
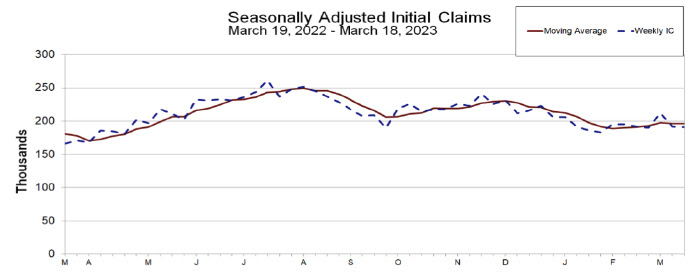
- Initial jobless claims decreased by 1,000 to 191,000
- The Q4 current account balance rose to -$206.8 billion
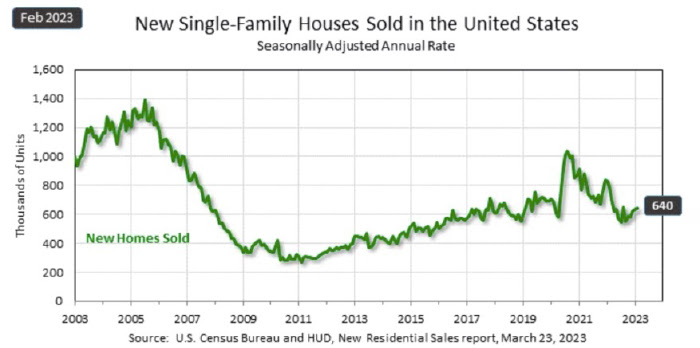
- On a year-over-year basis, new home sales were down 19.0%
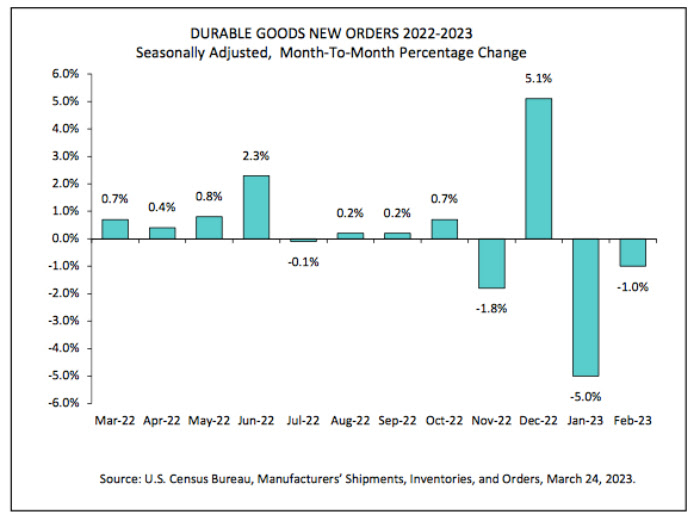
- Durable goods orders fell 1.0% month-over-month in February
- The IHS Markit Services PMI rose to 53.8 in the March reading versus the prior reading of 50.6
- The IHS Markit Manufacturing PMI rose to 49.3 in the preliminary reading versus the prior reading of 47.3
- New home sales increased 1.1% month-over-month in February
The Fed, The Fed, The Fed
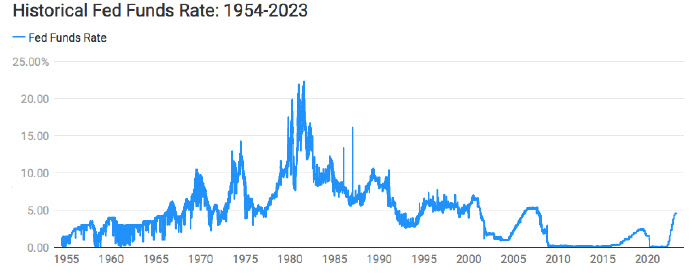
The most talked about event this week was the Federal Reserve’s policy meeting and as expected, the Fed raised official short-term rates by 25 basis points. Further, the “dot plot” pointed to hopes that the Fed might stop raising rates after one final on in May. Most interesting is that the fed funds futures markets ended the week pricing in a 98.2% chance that rates would end the year lower – with a whopping 95% chance that cuts would start this summer.
For perspective, it was almost exactly one year ago, on March 16, 2022, that the Federal Open Market Committee enacted the first of what would become nine consecutive interest rate increases.
Jobless Claims Dip Again
The Department of Labor reported that initial claims were 191,000, a decrease of 1,000 from the previous week. In addition, the 4-week moving average was 196,250, a decrease of 250 from the previous week’s unrevised average of 196,500.
- The advance seasonally adjusted insured unemployment rate was 1.2%
- The number for insured unemployment was 1,694,000, an increase of 14,000 from the previous week
- The 4-week moving average was 1,684,000, an increase of 8,500 from the previous week
Existing Home Sales Jump in February as Median Home Prices Slide for the First Time in Almost 11 Years
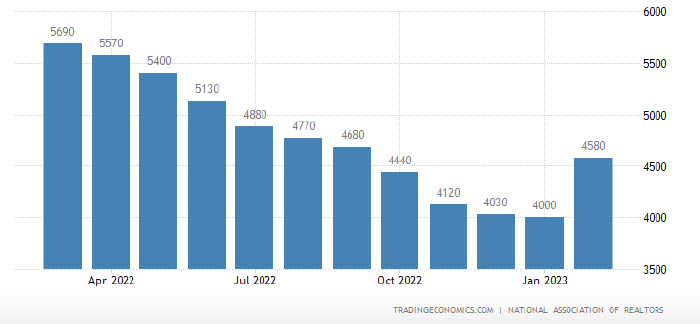
On Tuesday, the National Association of Realtors reported that “existing-home sales reversed a 12-month slide in February, registering the largest monthly percentage increase since July 2020. Month-over-month sales rose in all four major U.S. regions. All regions posted year-over-year declines.
- Total existing-home sales completed transactions that include single-family homes, townhomes, condominiums and co-ops – vaulted 14.5% from January to a seasonally adjusted annual rate of 4.58 million in February.
- Year-over-year, sales fell 22.6% (down from 5.92 million in February 2022).
- Total housing inventory registered at the end of February was 980,000 units, identical to January and up 15.3% from one year ago (850,000).
- Unsold inventory sits at a 2.6-month supply at the current sales pace, down 10.3% from January but up from 1.7 months in February 2022.”
Existing Home Sales
Median Prices Slide After 131 Months of Gains
- “The median existing-home price for all housing types in January was $363,000, a decline of 0.2% from February 2022 ($363,700), as prices climbed in the Midwest and South yet waned in the Northeast and West.
- This ends a streak of 131 consecutive months of year-over-year increases, the longest on record.
- Properties typically remained on the market for 34 days in February, up from 33 days in January and 18 days in February 2022.
- Fifty-seven percent of homes sold in February were on the market for less than a month.
- First-time buyers were responsible for 27% of sales in February, down from 31% in January and 29% in February 2022.
- All-cash sales accounted for 28% of transactions in February, down from 29% in January but up from 25% in February 2022.
- Distressed sales – foreclosures and short sales – represented 2% of sales in February, nearly identical to last month and one year ago.
Regional Breakdown
- Existing-home sales in the Northeast improved 4.0%, down 25.7% from February 2022. The median price in the Northeast was $366,100, down 4.5% from the previous year.
- In the Midwest, existing-home sales grew 13.5%, declining 18.7% from one year ago. The median price in the Midwest was $261,200, up 5.0% from February 2022. <./li>
- Existing-home sales in the South rebounded 15.9% in February, a 21.3% decrease from the prior year. The median price in the South was $342,000, an increase of 2.7% from one year ago.
- In the West, existing-home sales rocketed 19.4% in February, down 28.3% from the previous year. The median price in the West was $541,100, down 5.6% from February 2022.”
Durable Goods Orders Drop Again in February
The U.S. Census Bureau announces the February advance report on durable goods manufacturers’ shipments, inventories and orders:
New Orders
Shipments
Unfilled Orders
Inventories
Capital Goods
|
|
Sources dol.gov; nar.realtor; census.gov; msci.com; fidelity.com; nasdaq.com; wsj.com; morningstar.com; |
✅ BOOK AN APPOINTMENT TODAY: https://calendly.com/tdwealth
===========================================================
🔴 SEE ALL OUR LATEST BLOG POSTS: https://tdwealth.net/articles
If you like the content, smash that like button! It tells YouTube you were here, and the Youtube algorithm will show the video to others who may be interested in content like this. So, please hit that LIKE button!💥
🎯🎯🎯Don’t forget to SUBSCRIBE here: https://www.youtube.com/channel/UChmBYECKIzlEBFDDDBu-UIg
✅ Contact me: TDavies@TDWealth.Net
🔥🔥🔥 ====== ===Get Our FREE GUIDES ========== 🔥🔥🔥
🎯Retirement Income: The Transition into Retirement: https://davieswealth.tdwealth.net/retirement-income-transition-into-retirement
🎯Beginner’s Guide to Investing Basics: https://davieswealth.tdwealth.net/investing-basics
✅ LET’S GET SOCIAL
Facebook: https://www.facebook.com/DaviesWealthManagement
Twitter: https://twitter.com/TDWealthNet
Linkedin: https://www.linkedin.com/in/daviesrthomas
Youtube Channel: https://www.youtube.com/c/TdwealthNetWealthManagement
Lat and Long
27.17404889406371, -80.24410438798957
Davies Wealth Management
684 SE Monterey Road
Stuart, FL 34994
772-210-4031
DISCLAIMER
**Davies Wealth Management makes content available as a service to its clients and other visitors, to be used for informational purposes only. Davies Wealth Management provides accurate and timely information, however you should always consult with a retirement, tax, or legal professionals prior to taking any action.


Leave a Reply