EQUITIES RALLY AS DEBT CEILING IS RESOLVED AND SIGNS THAT THE LABOR MARKET IS SOFTENING BRING HOPE OF A PAUSE IN RATE HIKES

Weekly Market Update — June 3, 2023

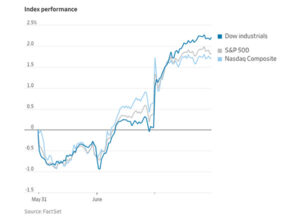
  • Despite a holiday-shortened week and uncertainty surrounding the debt ceiling, equity markets turned in some great numbers, with the smaller-cap Russell 2000 leading the way with a +3.3% weekly jump
  • The DJIA and tech-laden NASDAQ both turned in a very healthy +2.0% gain for the week, followed by the solid +1.8% gain for the S&P 500, which danced with that purely psychological 4,300 level on Friday
  • The big news on the week was the debt ceiling, which threatened to derail markets early in the week until a deal was finally agreed on by Congress and headed to President Biden’s desk
  • The other big news was from Fed-watchers, as pundits tried to decipher comments from certain Fed presidents as to whether we will see a pause or another hike in rates
  • The CME FedWatch Tool varied significantly all week, showing a 70% probability of another 25-basis points rate hike at the June meeting before plunging to about 25% at week’s end
  • The May ISM Manufacturing Index showed a drop in new orders
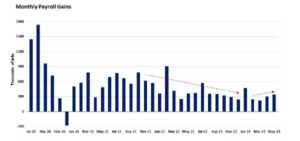
  • The May Employment Situation Report featured a 339,000 increase in nonfarm payrolls
  • Of the 11 S&P 500 sectors, they all advanced, with Consumer Discretionary (+3.3%) and Real Estate (+3.1%) leading the way and Utilities (+0.8%) and Consumer Staples (+0.3%) bringing up the rear
  • The 2-year Treasury yield fell to 4.51% and the 10-year Treasury fell 11 basis points to 3.69%
Weekly Market Performance

Close Week YTD
DJIA 33,763 +2.0% +1.9%
S&P 500 4,282 +1.8% +11.5%
NASDAQ 13,241 +2.0% +26.5%
Russell 2000 1,831 +3.3% +4.0%
MSCI EAFE 2,098 +0.9% +7.9%
*Bond Index 2,093.12 +0.36% +2.78%
10–Year Treasury Yield 3.69% -0.11% -0.2%

*Source: Bonds represented by the Bloomberg Barclays US Aggregate Bond TR USD. This chart is for illustrative purposes only and does not represent the performance of any specific security. Past performance cannot guarantee future results.

Equities Jump This Week After Debt Ceiling Agreement

The major U.S. equity markets turned in a very solid week, despite only four days of trading, with the S&P 500 Index hitting its highest intraday level since mid-August 2022. And while the smaller-cap Russell 2000 led the way with a weekly gain of more than 3%, Wall Street was quick to point out that NASDAQ turned in its sixth consecutive weekly gain.

markets

The week’s dominant news was the wrangling over the debt ceiling. But by week’s end, it was announced that the White House and Congress had reached an agreement to keep the government from defaulting on its obligations. After the Senate voted late Thursday, the bill headed to President Biden on Friday for his signature.

There was also a ton of economic data to report, and Wall Street was parsing through all things jobs-related in the hopes of guessing whether the Fed will raise rates at its next meeting in June.

Reviewing the week’s economic data, we saw that:

  • The FHFA Housing Price Index rose by 0.6% in March
  • The S&P Case-Shiller Home Price Index declined 1.1% in March
  • The Conference Board’s Consumer Confidence Index dropped to 102.3 in May
  • The weekly MBA Mortgage Applications Index fell 3.7% with purchase applications declining 3% while refinancing applications dropped 7%
  • The JOLTS Report showed job Openings at 10.103 million
  • Weekly Initial Claims were 232k
  • May IHS Markit Manufacturing PMI came in at 48.4 versus 48.5
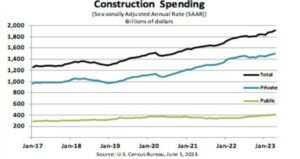
  • April Construction Spending advanced 1.2%
  • Nonfarm payrolls rose by 339,000 in May
  • Average hourly earnings rose by 0.3% in May
  • The unemployment rate rose to 3.7%
  • The average workweek fell to 34.3 hours

Jobs Market Softening

From the latest employment data, it appears from May’s payroll that the jobs market is still robust but there are also signs that it is tightening. Specifically, there were 339,000 new payrolls added in May, nearly double expectations and the best month of hiring since January.

markets

Further, the unemployment rate rose to 3.7%, the 16th consecutive month below 4% and the longest streak since the months between 1967 and 1970.

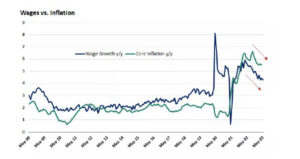
On the other hand, initial jobless claims moved higher last week, with new claims up more than 25% from the lows last year. In addition, wages grew at an annual pace of 4.3% last month, down from the previous month and at the slowest pace since June 2021 and still below current inflation levels.

markets

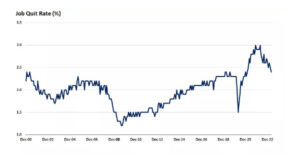
Finally, the rate of employees quitting their jobs has fallen, another sign of a softening labor market.

markets

Construction Up Significantly Year-over-Year

Construction spending during April 2023 was $1,908.4 billion, 1.2% above March. The April figure is 7.2% above April 2022. During the first four months of this year, construction spending amounted to $566.7 billion, 6.1% above the same period in 2022.

markets

  • Spending on private construction was 1.3% above March
  • Residential construction was 0.5% above March
  • Nonresidential construction was 2.4% above March
  • Public construction spending was $407.7 billion, 1.1% above March
  • Educational construction was $88.3 billion, 0.1% below March
  • Highway construction was 1.3% above March

Housing Prices Hint at Recovery as all 20 Major Metro Areas Rise in March

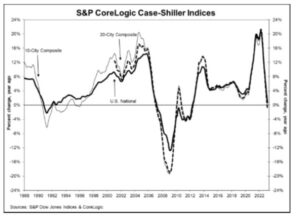
S&P Dow Jones Indices today released the latest results for the S&P CoreLogic Case-Shiller Indices, the leading measure of U.S. home prices. Data released today for March 2023 show a continuing recovery in housing prices, as all 20 major metro markets reported month-over-month price increases.

  • Before seasonal adjustment, the U.S. National Index posted a 1.3% month-over-month increase in March, while the 10-City and 20-City Composites posted increases of 1.6% and 1.5%, respectively.
  • After seasonal adjustment, the U.S. National Index posted a month-over-month increase of 0.4%
  • The 10-City Composite gained 0.6% and 20-City Composites posted an increase of 0.5%.

“The modest increases in home prices we saw a month ago accelerated in March 2023. The National Composite rose by 1.3% in March, and now stands only 3.6% below its June 2022 peak. Our 10- and 20-City Composites performed similarly, with March gains of 1.6% and 1.5% respectively. On a trailing 12-month basis, the National Composite is only 0.7% above its level in March 2022, with the 10- and 20-City Composites modestly negative on a year-over-year basis.

The acceleration we observed nationally was also apparent at a more granular level. Before seasonal adjustment, prices rose in all 20 cities in March (versus in 12 in February), and in all 20 price gains accelerated between February and March. Seasonally adjusted data showed 15 cities with rising prices in March (versus 11 in February), with acceleration in 14 cities.

One of the most interesting aspects of our report continues to lie in its stark regional differences. Miami’s 7.7% year-over-year gain made it the best-performing city for the eighth consecutive month. Tampa (+4.8%) continued in second place, narrowly ahead of bronze medalist Charlotte (+4.7%). The farther west we look, the weaker prices are, with Seattle (-12.4%) now leading San Francisco (-11.2%) at the bottom of the league table. It’s unsurprising that the Southeast (+5.4%) remains the country’s strongest region, while the West (-6.2%) remains the weakest.

Two months of increasing prices do not a definitive recovery make, but March’s results suggest that the decline in home prices that began in June 2022 may have come to an end. That said, the challenges posed by current mortgage rates and the continuing possibility of economic weakness are likely to remain a headwind for housing prices for at least the next several months.”

The chart below depicts the annual returns of the U.S. National, 10-City Composite, and 20-City Composite Home Price Indices.

markets

Sources

bls.gov;census.gov;spglobal.com;msci.com;fidelity.com;nasdaq.com;wsj.commorningstar.com;

Link to this article:

✅ BOOK AN APPOINTMENT TODAY: https://calendly.com/tdwealth

===========================================================

🔴 SEE ALL OUR LATEST BLOG POSTS: https://tdwealth.net/articles

If you like the content, smash that like button! It tells YouTube you were here, and the Youtube algorithm will show the video to others who may be interested in content like this. So, please hit that LIKE button!💥

🎯🎯🎯Don’t forget to SUBSCRIBE here: https://www.youtube.com/channel/UChmBYECKIzlEBFDDDBu-UIg

✅ Contact me: TDavies@TDWealth.Net

🔥🔥🔥 ====== ===Get Our FREE GUIDES  ========== 🔥🔥🔥

🎯Retirement Income: The Transition into Retirement: https://davieswealth.tdwealth.net/retirement-income-transition-into-retirement

🎯Beginner’s Guide to Investing Basics: https://davieswealth.tdwealth.net/investing-basics

✅ LET’S GET SOCIAL

Facebook: https://www.facebook.com/DaviesWealthManagement

Twitter: https://twitter.com/TDWealthNet

Linkedin:  https://www.linkedin.com/in/daviesrthomas

Youtube Channel: https://www.youtube.com/c/TdwealthNetWealthManagement

Lat and Long

27.17404889406371, -80.24410438798957

Davies Wealth Management

684 SE Monterey Road

Stuart, FL 34994

772-210-4031

https://TDWealth.Net

DISCLAIMER

**Davies Wealth Management makes content available as a service to its clients and other visitors, to be used for informational purposes only. Davies Wealth Management provides accurate and timely information, however you should always consult with a retirement, tax, or legal professionals prior to taking any action.